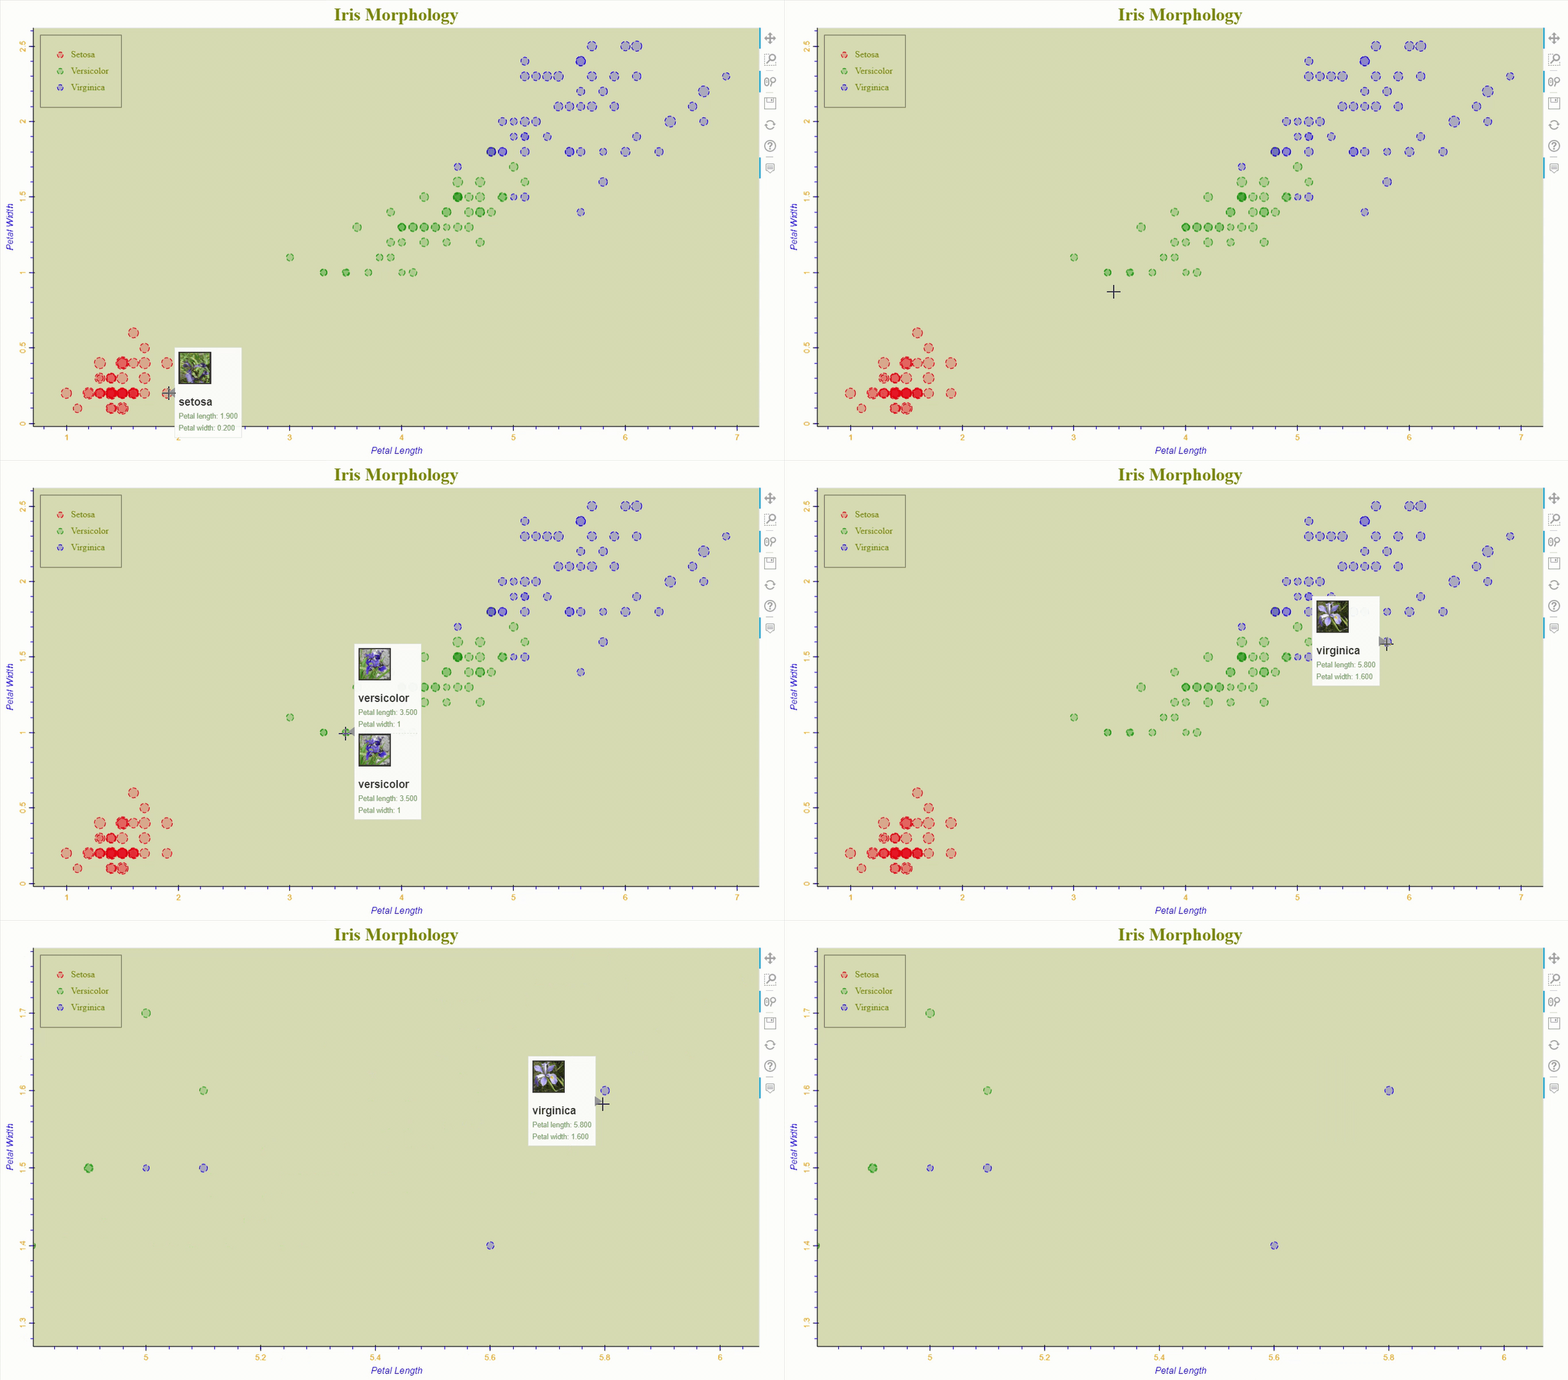
Bokeh is a data visualization library in Python. It provides highly interactive graphs and plots. What makes it different from other Python plotting libraries is that the output from Bokeh will be on the web page, meaning if we run the code in python editor the resulting plot will be in the browser. This gives the advantage of embedding the Bokeh plot on any website using Django or Flask.
Most of us are familiar with the iris dataset, it has morphological data of three different flower species namely Setosa, Virginica, and Versicolor. Let’s plot the above graph from scratch by learning the basics of Bokeh.
#exploratory-data-analysis #data-science #data-visualization #bokeh #data-analysis

2.45 GEEK