Introduction
Economics and data science can look very similar at times. Many techniques that have been used by economists for decades are imperative to data science and machine learning. The intersection comes not only from the close relationship of both fields to statistics, but also from the mathematics that drives their modeling processes.
In this post I will show the usefulness of applying economic methods to a data science-like problem. Although the technique used in this blog post is slightly more complicated than necessary for the problem, practicing on an easy task is a great way to learn a complicated procedure. Thus, I also hope to break down that technique (which is often implemented in machine learning) in a digestible way.
This post will discuss the following: defining a budget function, deriving a (Cobb-Douglas) production function from a dataset, framing an optimization problem with those functions, solving that problem using Newton’s method, and evaluating the results.
Framing the Problem
Imagine you work for a manufacturing company and one day you’re given a dataset [1] with the task of optimizing production. The dataset consists of three variables: quantity of output produced, quantity of capital input (how much raw materials were used), and quantity of labor input (how many workers were needed). Each observation in the dataset represents one week of production. The product that your company manufactures is in high demand at the moment, so your boss wants to be able to put out as much of it as possible. Your job is to determine what quantities of labor and capital should be used to achieve this. These quantities are constrained by the company’s overall budget.
The company has $5 million to put towards production. It pays $1.5 thousand for each unit of capital input and it pays its workers $1.92 thousand per week. This budget can take the form of the basic cost function shown in equation 1:
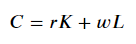
Equation 1. Cost function denoting the company’s budget
Where C is the cost or budget, r is the rental rate of capital, K is the quantity of capital, w is the wage rate, and _L _is the quantity of labor. Plugging in these values, the budget function takes the following form:
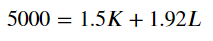
Equation 2. The company’s budget function
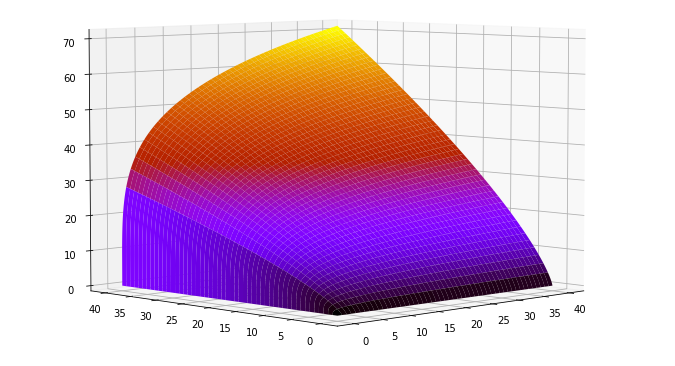
The production function is more difficult to come by. Figure 1 shows the company’s output plotted against both the input factors in the left hand column. The right hand column shows the log transformation of output and input factors.
#optimization #economics #newtons-method #data-science #modeling