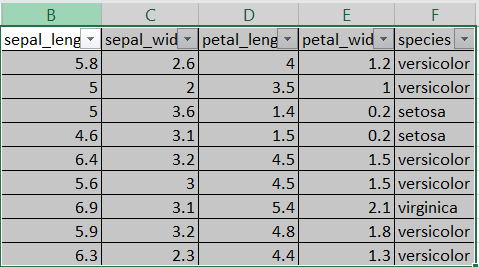
The class in this case is the species and that is what needs to be predicted.
Here is a flowchart of the steps taken in general:
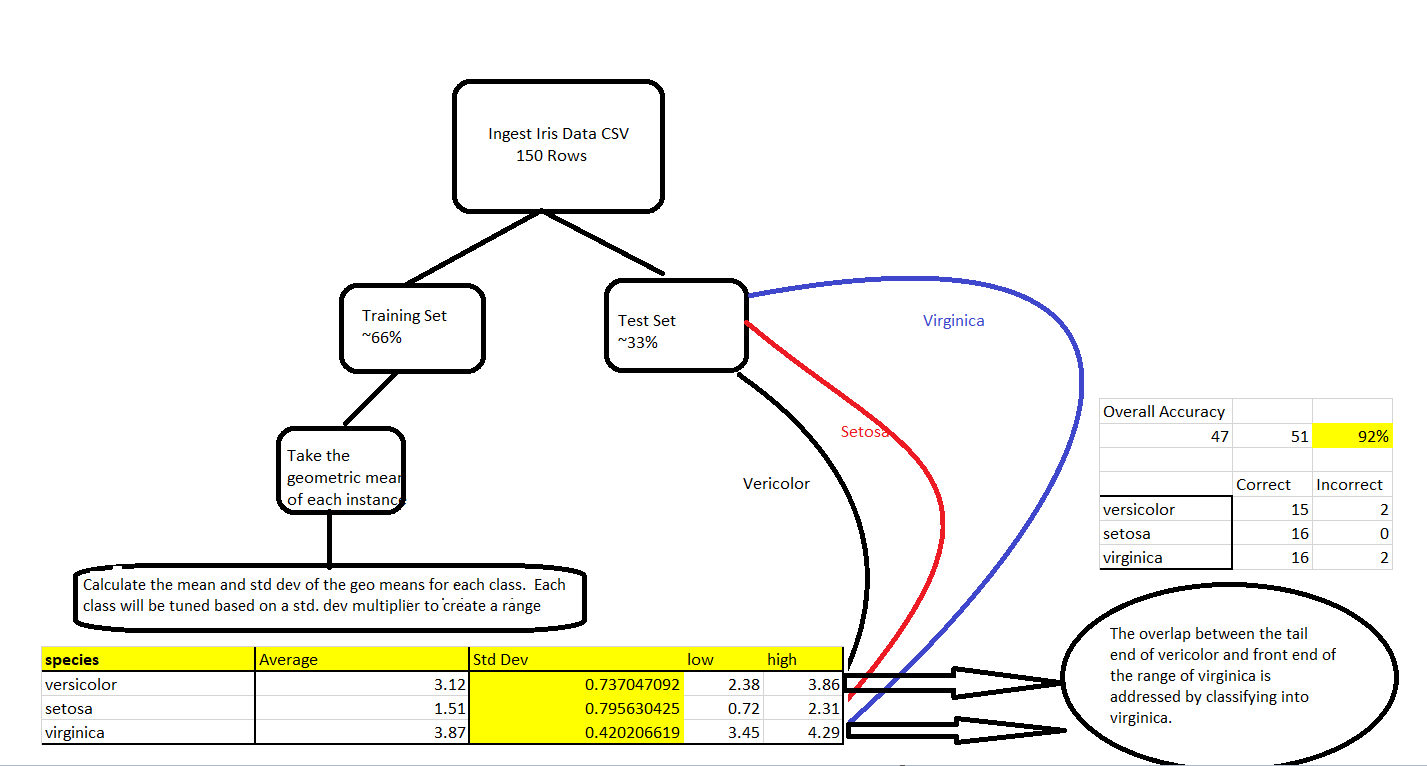
Source: Image created by the author.
Before you try the algorithm, do your pre-processing steps. Randomize the dataset and then split it into training and test dataset. You can do a 2/3 and 1/3rd split for training and test respectively. This is normal.
These are the steps to the algorithm:
**1. **Make a field that calculates the geometric mean of the attributes given, which in this case are sepal_length, septal_width, petal_length, and petal_width. Do this for each instance of the training data
2. Find the average of the geometric means for each class in the training data i.e the average of the geometric means within Versicolor, setosa, and virginica.
3. Find the standard deviation of the geometric means for each class in the training data.
**4. **Find the low high range for each class using the following formula: [Average from step 2 +/- std deviation from step 3]
5. The classification will be based on the ranges. If the geometric mean of a row in the test data falls within the range, select that class as the label.
6. The next part will show tuning. Tuning the algorithm using the standard deviation multiplier is also going to create overlap depending on what multiplier you use. You can use different methodologies to address overlap:
Tuning:
1. Note that in the algorithm above, each class has a different multiplier for its standard deviation. To tune the algorithm, change the multiplier of the standard deviation for each class separately. The multipliers will change the high low range and significantly alter the accuracy of classification. In fact, the entire accuracy of the model is based on picking proper multipliers.
#classification-algorithms #data-science #classification #machine-learning #deep learning