How to Analyze the Next.js App Bundles
We’ll discuss what a Next.js app bundle is and how bundle analyzer tools work. Learn how to analyze the Next.js app bundles to identify areas for optimization, reduce your codebase, and improve app performance.
One crucial aspect of any web application is the size and performance of its codebase. Next.js is a popular JavaScript framework for building server-rendered and statically-exported React applications.
Next.js provides the ability to automatically optimize an application’s code and minimize its bundle size. This can reduce the amount of data that needs to be transferred to the client, thereby improving performance. However, regularly analyzing your Next.js app’s bundle can help ensure that it is as optimized as possible and can also help identify potential areas for improvement.
In this article, we’ll discuss what a Next.js app bundle is and how bundle analyzer tools work. We’ll demonstrate how to use the @next/bundle analyzer package to inspect your Next.js app bundles and talk about a few alternatives. Lastly, we’ll discuss how to use bundle analysis to improve Next.js app performance.
Contents:
- What is a Next.js app bundle?
- What is the @next/bundle-analyzer?
- Installing the @next/bundle-analyzer package
- Configuring the Next.js app
- Analyzing the Next.js app bundles
- Inspecting the Next.js app bundles
- Via the terminal
- Via the browser
- Using the sidebar filter
- Creating an analysis command/script
- Optimizing app performance with bundle analysis
- Alternatives to @next/bundle-analyzer
What is a Next.js app bundle?
When you build a Next.js app, the code gets organized into small units called modules. These modules are bundled together by webpack, a popular JavaScript module bundler, to form a single file called a bundle. This bundle is then served to the client’s browser, which is executed to render the application.
As web applications become more complex and feature-rich, the size of their codebase can grow significantly. This can lead to slower loading times, which can frustrate users and negatively impact your app’s performance.
Additionally, larger codebases are often more challenging to maintain, making it harder to identify and fix bugs. By analyzing your app bundles, you can identify areas where you can optimize your code to reduce its size and improve its performance.
Several bundlers exist, but this article will focus on using one of the most popular bundling tools, the webpack-based @next/bundle-analyzer package.
What is @next/bundle-analyzer?
The @next/bundle-analyzer package is a plugin for the Next.js framework that allows you to analyze the size and composition of your app’s bundle. By identifying large or unnecessary code blocks, you can reduce overall bundle size, which can help optimize the performance of your Next.js app.
The bundle-analyzer plugin generates a visual report that provides information about the size and contents of your app bundle, making it easier to identify areas for optimization. @next/bundle-analyzer generates a static HTML file that contains a detailed report on your app’s codebase, including information on the size of each component and its dependencies.
Installing the @next/bundle-analyzer package
To use the @next/bundle-analyzer package, you must install it into an existing Next.js project. For this tutorial, I’ll use my open source project, Tech Career Roadmap, as the Next.js example project.
To start, install the package with either npm or Yarn:
# npm
npm install --save-dev @next/bundle-analyzer cross-env
# Yarn
yarn add -D @next/bundle-analyzer cross-env
You’ll notice that I also installed cross-env; we’ll use this package later in this article to set an environment variable. The cross-env package will allow us to set environment variables when running scripts in our package.json file without any errors, regardless of our platform-specific syntax or our OS.
Configuring the Next.js app
After you’ve installed the packages, you can enable the bundle analyzer by adding the following code to your next.config.js file:
const withBundleAnalyzer = require('@next/bundle-analyzer')({
  enabled: process.env.ANALYZE === 'true',
})
module.exports = withBundleAnalyzer({
  // your Next.js configuration
})
Analyzing the Next.js app bundles
To run an analysis for your app bundles, you’ll need to start your Next.js app in development mode with the ANALYZE environment variable set to true. Then, run the following command to view the analysis:
ANALYZE=true npm run buildThis command will automatically:
- Create an
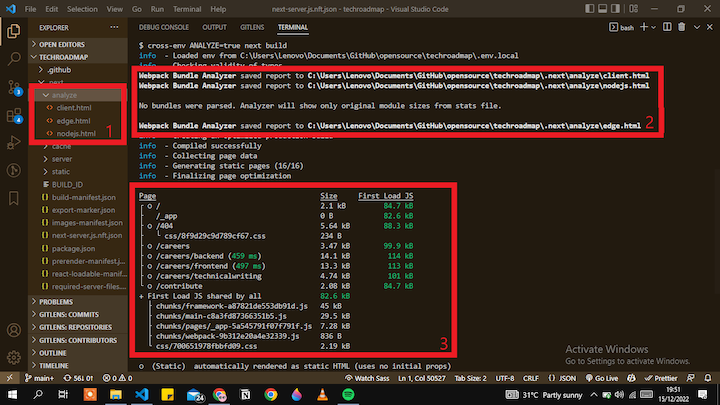
analyzefolder in your.nextfolder inside your root directory and create three files:client.html,nodejs.html, andedge.html - Open the three files in your browser; the
client.htmlfile represents the client side, and thenodejs.htmlfile represents the server side. At this time of writing, there is no data supplied for theEdge.htmlpage. It will presumably represent edge APIs, but we have been unable to get confirmation from the package’s maintainers - Provide bundle analysis information in your terminal
After the bundle analyzer has run, you can start inspecting your bundles:
Inspecting the Next.js app bundles
The @next/bundle-analyzer package provides a few ways to inspect your bundles: via the terminal, via the browser, and by using the sidebar filter. Let’s take a look.
Via the terminal
In the above image showing the terminal output, there’s a table displaying Page, Size, and First Load JS. Under the Page header is a list of all the pages in your Next.js app and chunks from the First Load JS bundle.
The First Load JS bundle is all the code shared or used by the app pages at initial load. Under the Size header, the package displays the file size of each page, bundle, and the chunks that make up the bundle.
Under the First Load JS, you can see the final size of the page or after the First Load JS has been added. The First Load JS size is also the initial size of the pages on initial load.
Next.js also color codes these sizes. Green tells us that the size is small and ok, while red indicates that the size is too large. If your First Load JS bundle size is shown in red, try to reduce it until it is displayed in green because the size of the bundle also affects the size and state of all your pages.
Via the browser
To inspect your app bundles in your browser, simply go to your browser to see two pages opened for you by the analyzer.
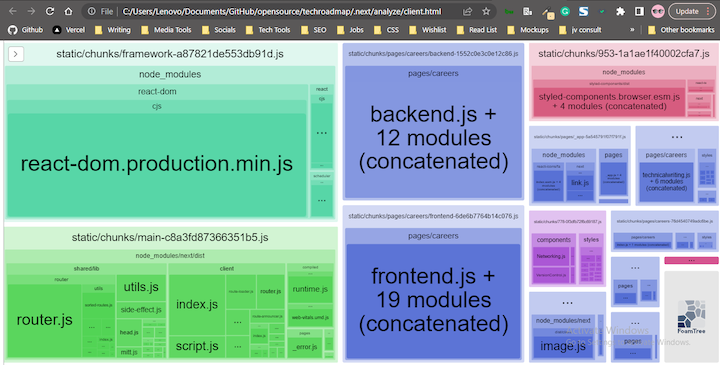
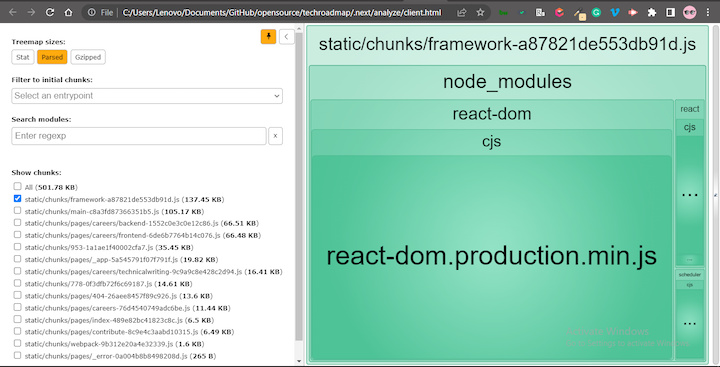
The first page, client.html, displays all the bundles for the client side:
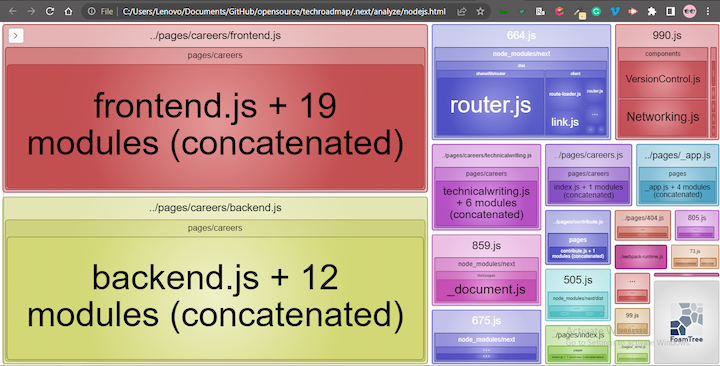
The second page, nodejs.html, displays all the bundles for the server side:
If your app’s pages are not automatically loaded, or if you have already closed the browser, just go into the analyze folder and right-click on any file names in order to open them in your browser.
Next, simply hover over any of the bundles to see its stats. You’ll be able to see the Stat size, Parsed size, and Gzipped size of each bundle, as well as the bundles’ file path.
Here’s a little more detail on the size types:
- Stat size: The size of the JavaScript bundle when served to the client; this is the size of the JavaScript code that the client’s web browser has to download and execute to run the app
- Parsed size: The size of the bundle after the web browser has parsed it; this is the amount of memory that the JavaScript code takes up in the web browser after it has executed the code
- Gzipped size: The size of the JavaScript bundle when compressed using the Gzip algorithm; this is the amount of data the client’s web browser must download to run the app. Gzip is a common compression algorithm used to reduce the size of web assets like JavaScript files. It can significantly reduce the amount of data transferred over the network
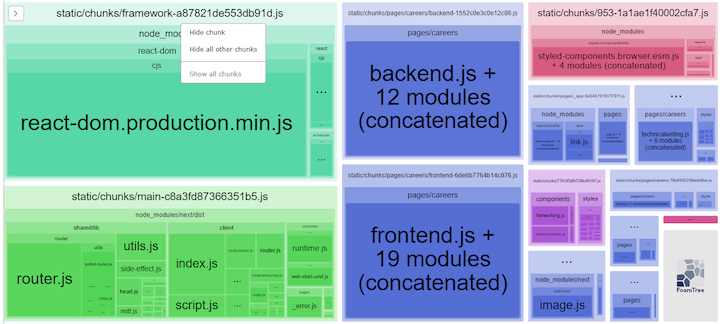
With the analyzer pages in the browser, you’ll be able to see which bundles are taking up the most space based on their size type. Also, the bundles are arranged based on their file sizes:
You can also right-click on the root bundle to view options related to that chunk. You can click Hide chunks to hide that particular chunk from view and view the rest, click Hide all other chunks to hide all other chunks except the one you clicked on, or click Show all chunks to show all the chunks that are currently hidden:
Using the sidebar filter
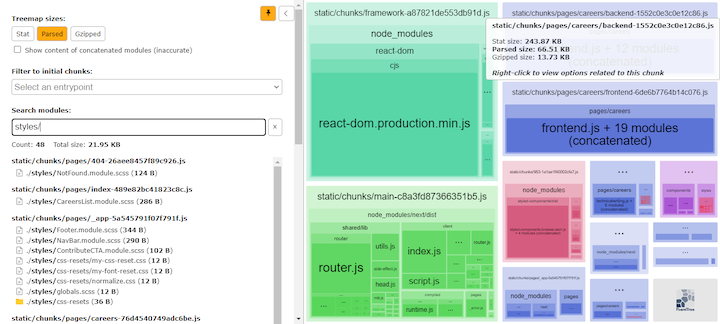
Another way to interact with and inspect your bundles is to use the sidebar filter. In the sidebar, you can specify a particular bundle or set of bundles that you’d like to view.
This approach can be useful for visualizing and inspecting smaller bundles quickly. You can also opt to have them ordered based on the size type: Stat, Parsed, or Gzipped:
You can search for modules using a particular file, folder, or phrase from your app; the analyzer will display results based on your search input:
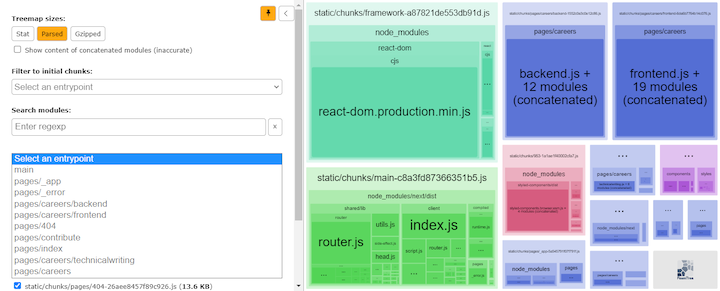
Or, you can select an entry point for initial chunks (i.e., any of your app’s pages):
Creating an analysis command/script
To save time, you can also create a quick command/script to run in your package.json file. By doing so, you can avoid setting the environment variable on every call.
In your package.json file, add the following script:
"scripts": {
…
"analyze": "cross-env ANALYZE=true next build"
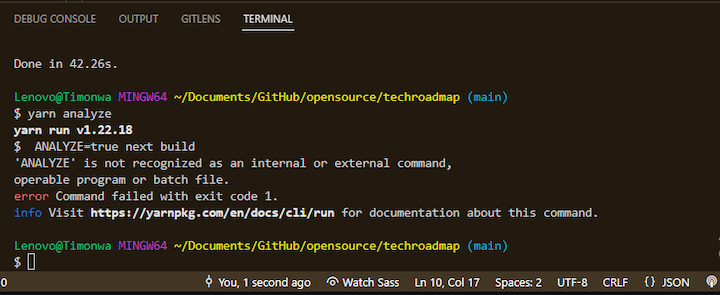
},As I mentioned previously, cross-env allows us to set environment variables in our package.json file. In this case, we are setting ANALYZE to true. If you were using a Windows operating system and didn’t install cross-env, you’d get an error like the one shown below when running the above script:
Now, let’s test our code by running one of the following commands:
# npm
npm run analyze
# Yarn
yarn analyze
Running either of the above command results in the same action as running the following:
ANALYZE=true npm run buildOptimizing app performance with bundle analysis
Bundle analysis is an essential tool for optimizing app performance. It helps identify potential bottlenecks and areas for improving an app’s load speed and reducing its bundle size.
Let’s consider the scenario of a Next.js app that was analyzed with the @next/bundle-analyzer tool; the following issues were identified:
- Large image file sizes: this can slow down an app’s load speed
- Duplicate npm packages: this will increase the app’s bundle size unnecessarily
- Unused npm packages: this will contribute to the app’s bundle size and slow down its load speed
- Heavy JavaScript files: Unoptimized JavaScript files will add to an app’s bundle size
To optimize the app’s performance, here are some possible ways to address the above issues:
- Compress or resize images with large file sizes
- Remove duplicate npm packages
- Remove unused npm packages
- Use minification, tree shaking, and code splitting to optimize JavaScript files
Alternatives to @next/bundle-analyzer
While @next/bundle-analyzer is a popular choice for analyzing the bundle size of a Next.js app, several other options are available. Here are some alternatives to consider:
- webpack-bundle-analyzer: This widely-used tool analyzes the bundle size of webpack-based applications, including Next.js. It generates interactive visualizations of the bundle size and composition, making it easy to identify which modules take up the most space
- next-bundle-analyzer: This community-driven alternative to the official @next/bundle-analyzer package provides similar functionality but with customized reports specifically for Next.js users
- source-map-explorer: This popular tool analyzes the bundle size of an app by examining the source maps generated during the build process. It provides a treemap visualization of the bundle size and identifies where each byte of code is coming from
- Statoscope: This web-based tool analyzes the size and composition of webpack bundles. It provides a simple interface for users to upload webpack stats files and generate visualizations that help identify which modules and dependencies contribute most to the app’s bundle size
These are just a few of the many options available for analyzing the bundle size of a Next.js app. Consider experimenting with different tools to find the one that best meets your needs.
Conclusion
In this article, we discussed what a Next.js bundle is and investigated how bundle size can impact website performance. We also demonstrated how to use the @next/bundle-analyzer package to analyze and inspect the bundles in various ways, such as in the terminal, the browser, and the tool’s sidebar filter.
Through this analysis, you’ll identify potential bottlenecks, such as duplicated or unused npm packages and large image sizes. You’ll be able to optimize your app’s performance by reducing bundle size and improving load speed. Bundle analysis is a critical tool for any developer looking to optimize their Next.js application and enhance user experience.
Source: https://blog.logrocket.com
#nextjs