Easy pivot() in BigQuery, in one step
Introducing the easiest way to get a pivot done in BigQuery. This has been one of the most recurrent BigQuery open questions. And now, thanks to dynamic SQL and stored procedures, we can finally make it easy for everyone.
Quick pivots
Before going any further, let me show you how to call fhoffa.x.pivot() to easily pivot any table, creating a new one with the results:
CALL fhoffa.x.pivot(
  'bigquery-public-data.iowa_liquor_sales.sales' # source table
  , 'fh-bigquery.temp.test' # destination table
  , ['date'] # row_ids
  , 'store_number' # pivot_col_name
  , 'sale_dollars' # pivot_col_value
  , 30 # max_columns
  , 'SUM' # aggregation
  , '' # optional_limit
);
That’s it. Let’s see what’s happening here. The original table has one row per sale (invoice), including the date of the transaction, the store number, and the sale amount:
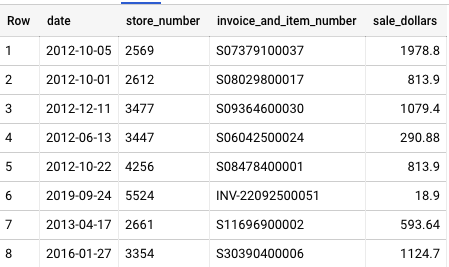
Original table to be pivoted
Then if someone requests a transformation like “I want to see the total amount sold per day per store, with each store in its own column” — that’s a pivot. The code above will create a new table that looks exactly like requested:
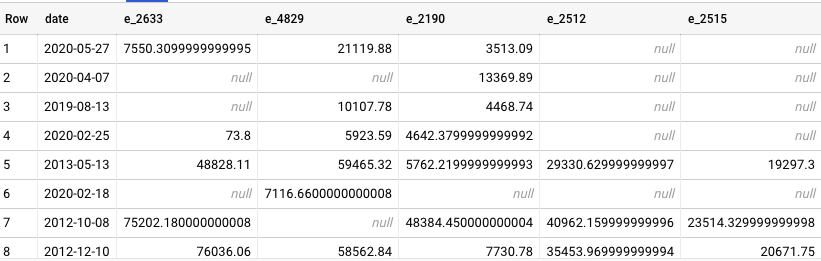
Pivoted table, with one store per column
Let’s review each line of the above code:
CALL fhoffa.x.pivot(): The first thing you might notice is the keywordCALL. That’s how you run a stored procedure like thispivot(). I shared it in my datasetfhoffa.x, so you can call it at any moment too. The following lines are the parameters for that stored procedure. Note that most of these parameters strings:‘bigquery-public-data.iowa_liquor_sales.sales’:Denotes the table we want to pivot. In this case, a public table sharing the liquor sales in Iowa.‘fh-bigquery.temp.test’: The stored procedure will create (or overwrite) this table, with the pivoted results.[‘date’]: An array with the list of the dimensions we want to summarize for on each row. Here it’s justdate, because all we want is a summary per day.‘store_number’: This is the column name for the column with the values we want to transform into columns.
#sql #data-science #data-engineering #bigquery #data analysis

114.30 GEEK