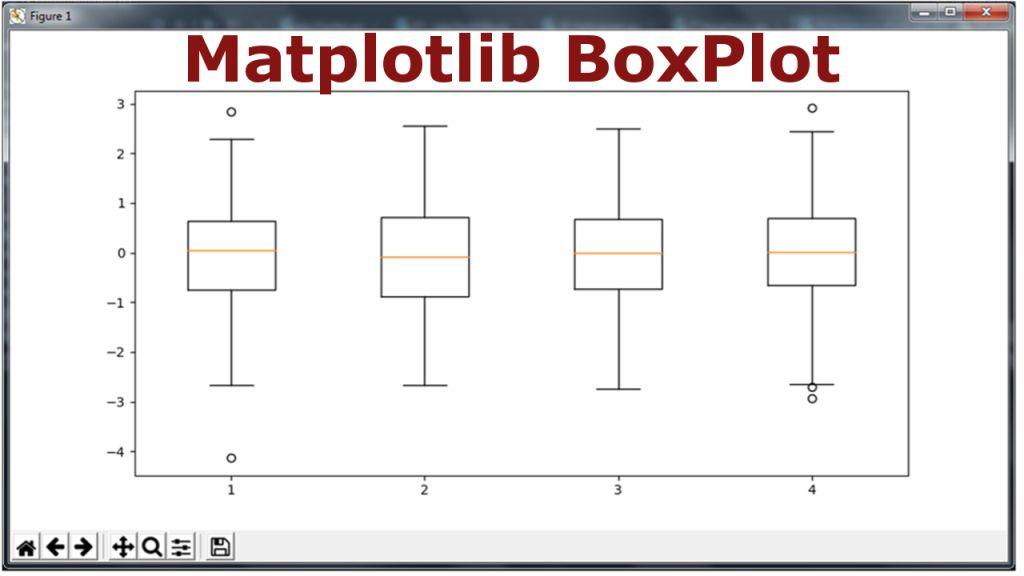
This is our seventh article in Python Matplotlib, in this article we are going to learn about Matplotlib Plotting BoxPlot. so in descriptive statistics, a box plot or boxplot is a method for graphically depicting groups of numerical data through their quartiles. Box plots may also have lines extending from the boxes indicating variability outside the upper and lower quartiles, hence the terms box-and-whisker plot and box-and-whisker diagram. also Boxplot allows you to compare distributions of values by conveniently showing the median, quartiles, maximum, and minimum of a set of values.
#matplotlib #python tutorials #matplotlib boxplot #python matplotlib
2.20 GEEK