In Data Science Project, UML Diagram is very essential to illustrate a conceptual model of your problem domains with the component- or class diagrams; or to show how your machine and algorithm works with the sequence- or activity diagrams. Some of you might draw this regularly on paper or using some software such as PWP or Adobe AI which causes you a headache sometimes if you not an expert.
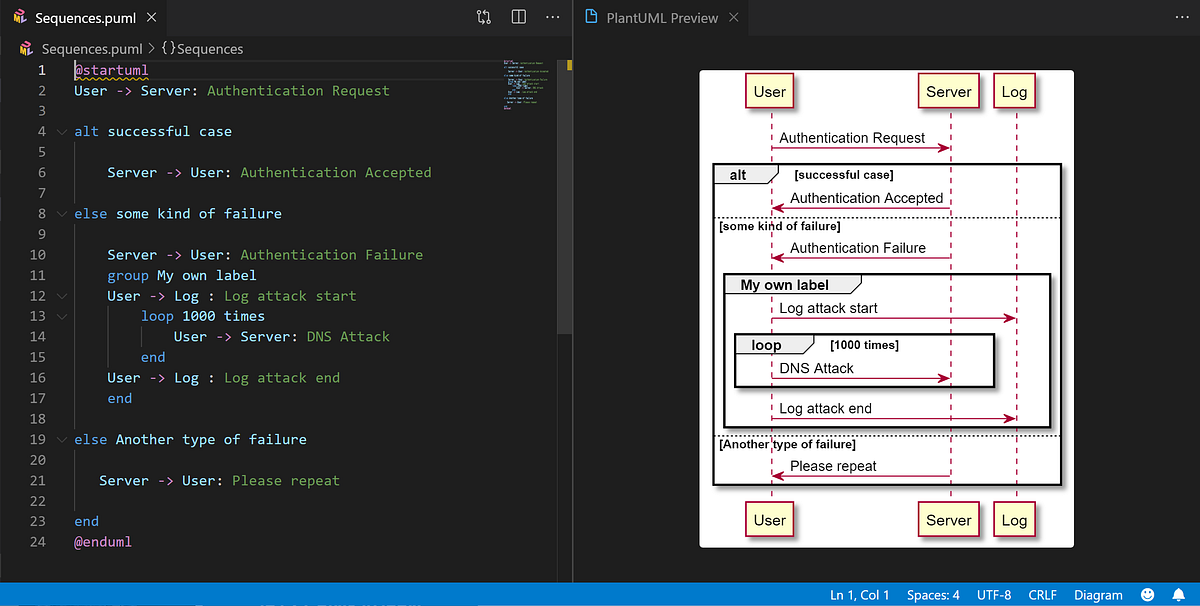
Many online tools such as https://www.diagrams.net/ also allow you to draw the diagram but sometimes cause you much time to create a complex diagram. So, instead of drawing manually, this short article introduces an alternative way by showing how to draw diagrams using plain text (Easy-to-Understand Script) with PlantUML (https://plantuml.com/). It is an open-source tool and syntax for creating a UML diagram. With this tool, you can create a wide variety of UMLs, from a simple flowchart to a complex diagram. By installing the PlantUML as a VS Code extension, you can edit it right inside the VSCode software as in the example gif animation below.
Create a Simple Sequence Diagram in VSCode (by Author)
Requirement
- Install VS Code
- Install PlantUML Extension
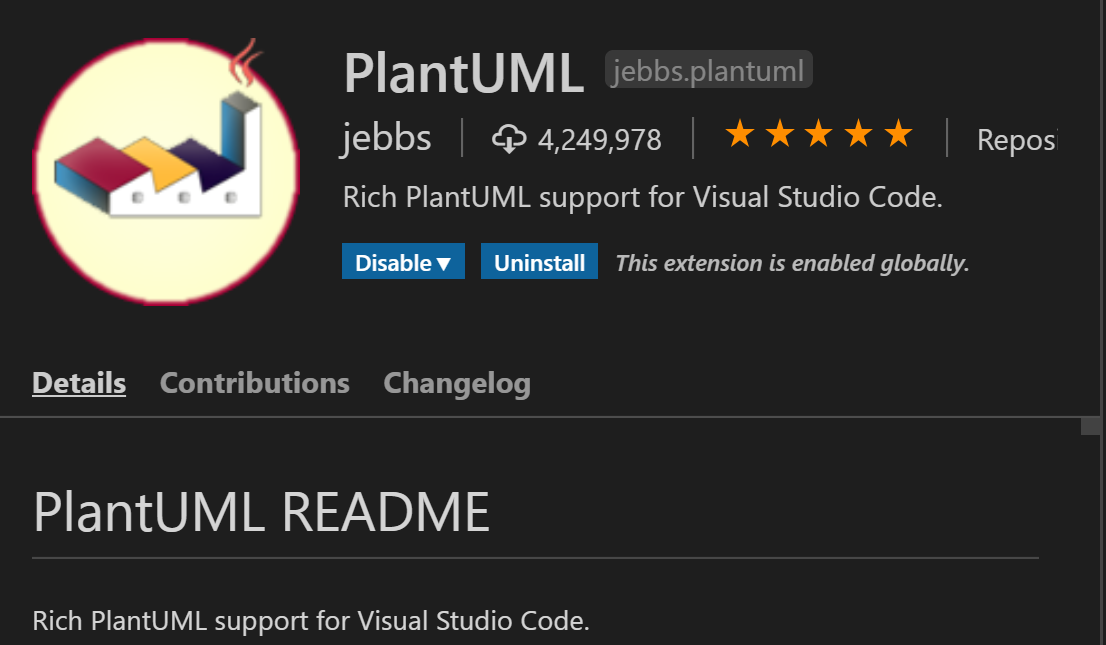
PlantUML Extension (Screenshot from VS Code by Author)
Start Drawing Your First Diagram
To start drawing the UML diagram, first, check the syntax document from https://plantuml.com/. As there is plenty of good example syntax on the main PlantUML main site which is easy to understand, I will skip about how the syntax.
After you get to know the syntax for PlantUML, just open your project folder in VS Code and create a file with .puml file type and start writing your UML code. You can also see a real-time change of the update by right click on the VS Code script window and select “Preview Current Diagram” or hit “Alt + D” (This option is available for you whenever editing the .puml file after you install the PlantUML extension).
#data-analysis #data-science #plantuml #diagrams #uml