I recently read an article called Anomaly Detection with Autoencoders. The article was based on generated data, so it sounded like a good idea to apply this idea to a real-world fraud detection task and validate it.
I decided to use Credit Card Fraud Dataset From Kaggle*:
The datasets contains transactions made by credit cards in September 2013 by european cardholders.
This dataset presents transactions that occurred in two days, where we have 492 frauds out of 284,807 transactions. The dataset is highly unbalanced, the positive class (frauds) account for 0.172% of all transactions.
It is a very unbalanced dataset and a good candidate to identify fraud through anomalies.
Let’s start with data discovery:
We are going to do a smaller plot after decreasing our dimensions from 30 to 3 with Principal Component Analysis. This data has 32 columns where the first column is the time index, 29 unknown features, 1 transaction amount, and 1 class. I will ignore the time index since it is not stationary.
def show_pca_df(df):
		x = df[df.columns[1:30]].to_numpy()
		y = df[df.columns[30]].to_numpy()

		x = preprocessing.MinMaxScaler().fit_transform(x)
		pca = decomposition.PCA(n_components=3)
		pca_result = pca.fit_transform(x)
		print(pca.explained_variance_ratio_)

		pca_df = pd.DataFrame(data=pca_result, columns=['pc_1', 'pc_2', 'pc_3'])
		pca_df = pd.concat([pca_df, pd.DataFrame({'label': y})], axis=1)

		ax = Axes3D(plt.figure(figsize=(8, 8)))
		ax.scatter(xs=pca_df['pc_1'], ys=pca_df['pc_2'], zs=pca_df['pc_3'], c=pca_df['label'], s=25)
		ax.set_xlabel("pc_1")
		ax.set_ylabel("pc_2")
		ax.set_zlabel("pc_3")
		plt.show()

	df = pd.read_csv('creditcard.csv')

	show_pca_df(df)
view raw
anomaly_detection_part1_1.py hosted with ❤ by GitHub
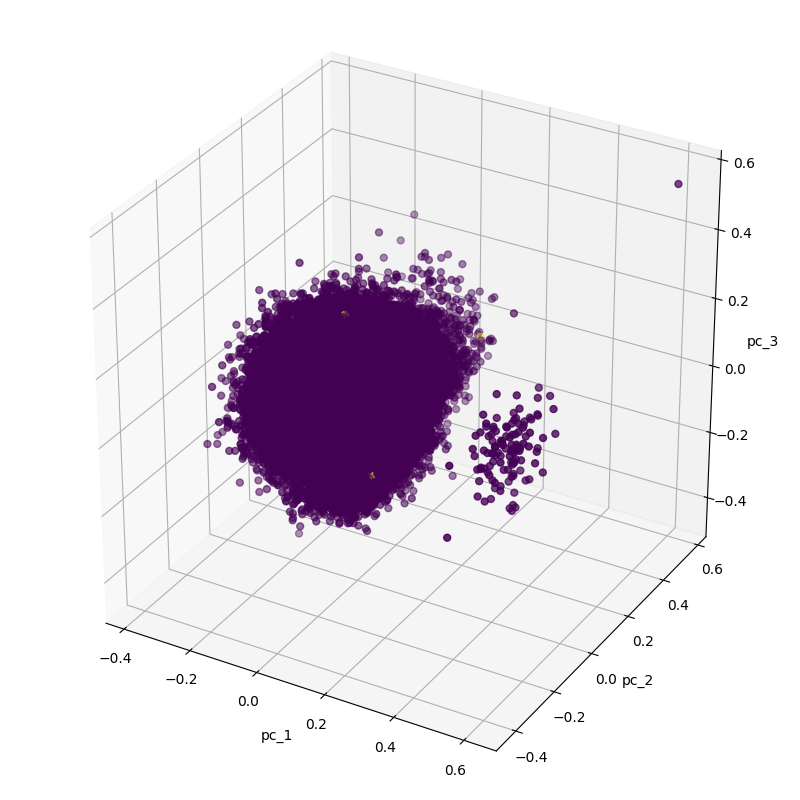
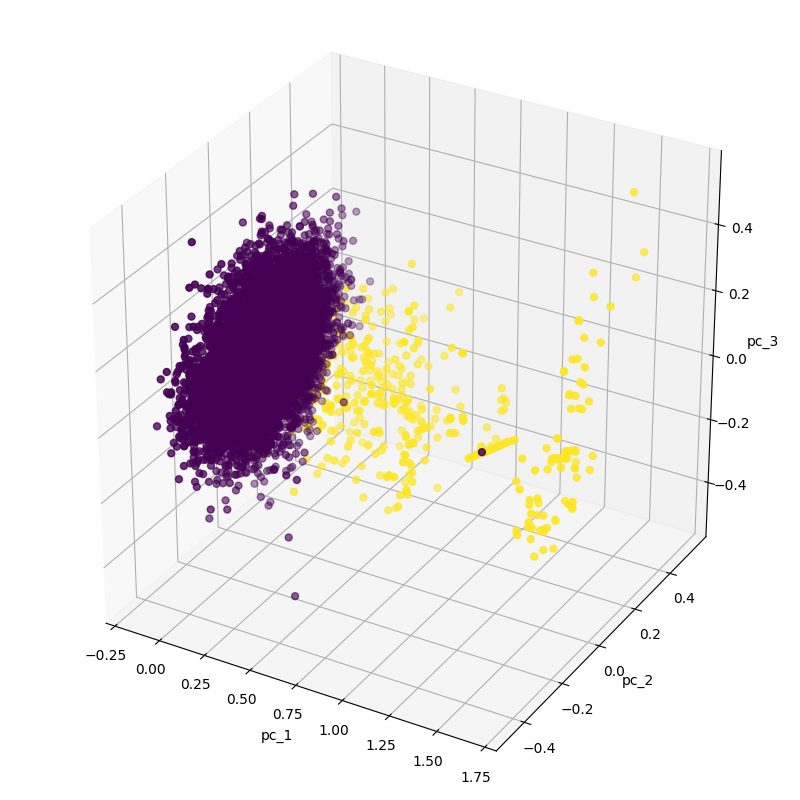
Your first reaction could be that there are two clusters and this would be an easy task but fraud data is yellow points! There are three visible yellow points in the large cluster. So let’s subsample the normal data while keeping the number of fraud data.
df_anomaly = df[df[df.columns[30]] > 0]
	df_normal = df[df[df.columns[30]] == 0].sample(n=df_anomaly.size, random_state=1, axis='index')
	df = pd.concat([ df_anomaly, df_normal])

	show_pca_df(df)
view raw
anomaly_detection_part1_2.py hosted with ❤ by GitHub
#keras #anomaly-detection #deep-learning #tensorflow #fraud-detection #deep learning