Full Disclaimer: I love coffee from Sweet Maria’s, and I’ve been regularly buying most of my green coffee from them for the past 6 years.
I looked at the sub-metrics of their coffee grades to have a better understanding of how useful they are to comparing coffees to each other. I used box-plots, correlation, and Principle Component Analysis (PCA) to understand these coffee grades. This work is another extension of the ideas comparing a large Q-grade CQI database to understand how useful their metrics for grading coffee are in terms of distinguishing coffees from one another.
Cupping Scores (modified Q-scores)
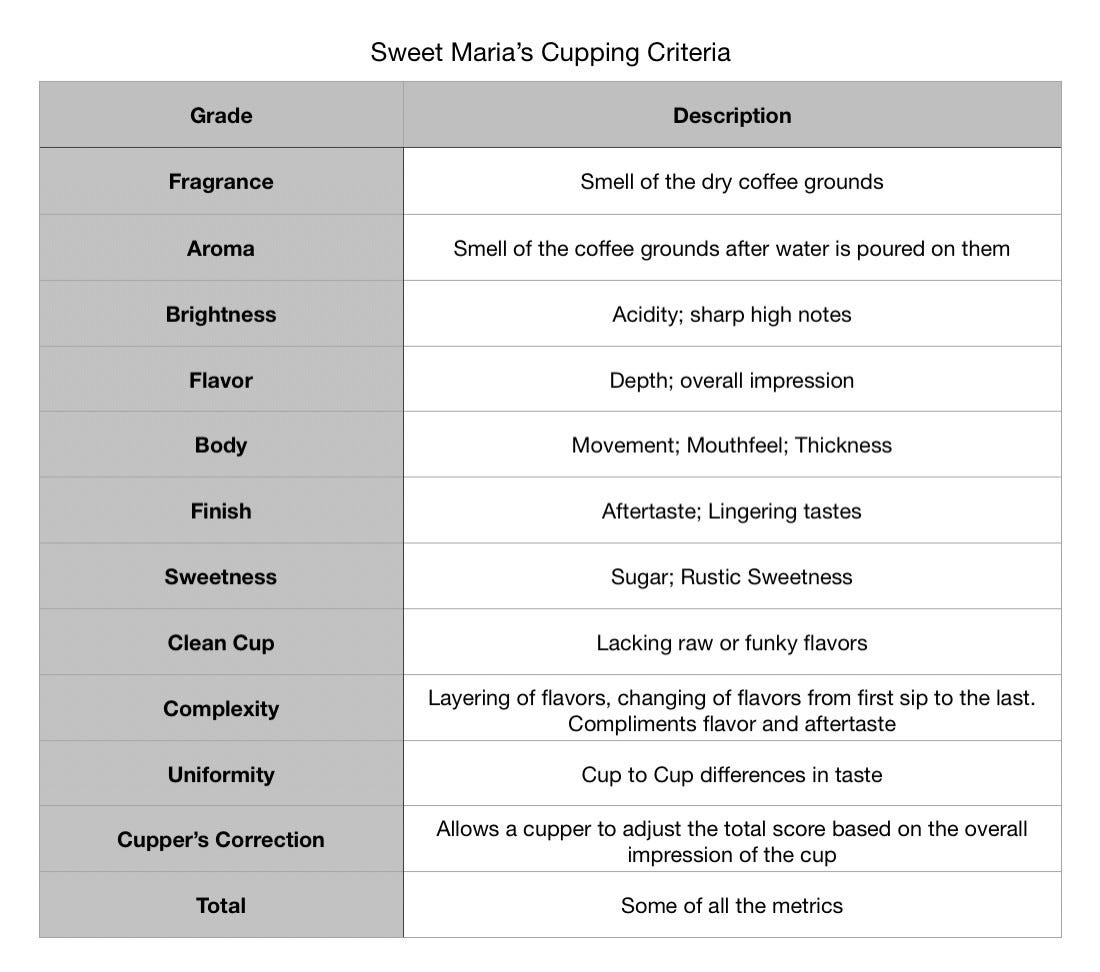
Sweet Maria’s has a slightly different cupping criteria than the SCA criteria summarized below. It is curious to see how sweetness, uniformity, and clean cup compare to the other data. Where these 3 metrics for the SCA scale start out perfect and points are deducted, Sweet Maria’s metrics give a bit more insight into the coffee.
Raw Data
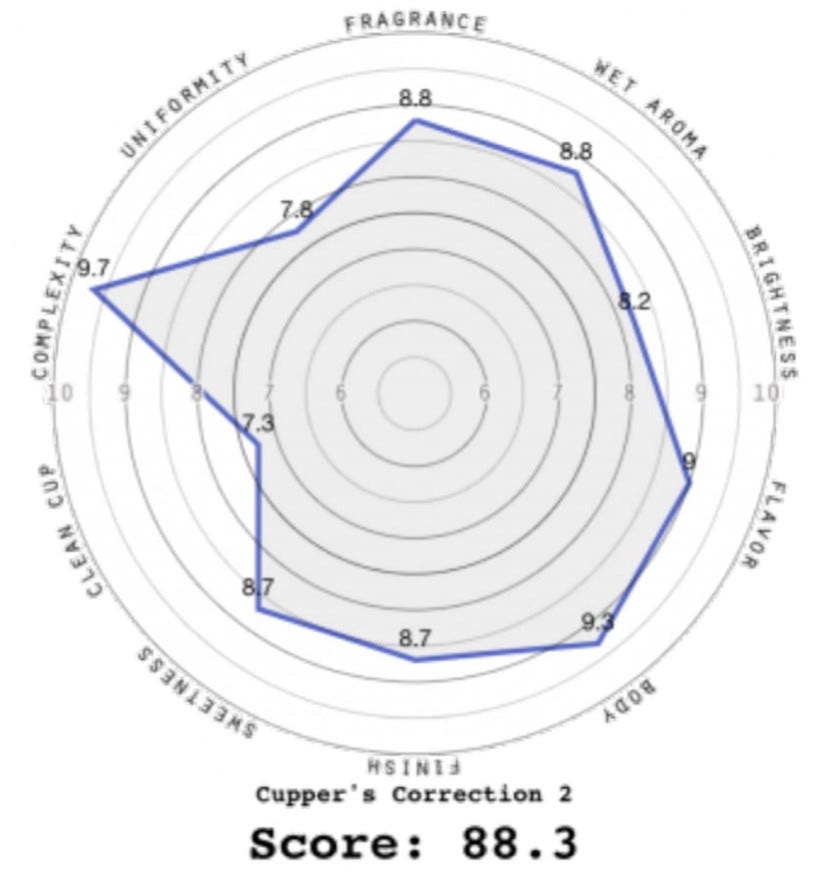
Pulling data from Sweet Maria’s was not the easiest to do. They don’t have a database to pull from, but they have an archive of over 300 beans from over the years. I pulled part of the data manually as discussed in this piece, and in pulling the data this way, I had a spider graph for each coffee.
#data-science #analysis #espresso #data #coffee