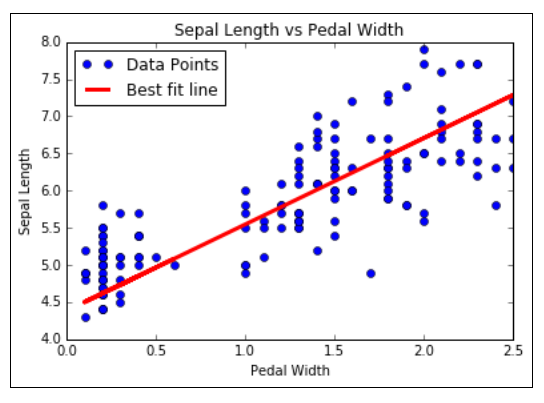
We will loop through batches of data points and let TensorFlow update the slope and y-intercept. Instead of generated data, we will use the iris dataset that is built into the Scikit Learn. Specifically, we will find an optimal line through data points where the x-value is the petal width and the y-value is the sepal length. We choose these two because there appears to be a linear relationship between them, as we will see in the graphs at the end. We will also talk more about the effects of different loss functions in the next section, but for now we will use the L2 loss function.
How to do it…
- We start by loading the necessary libraries, creating a graph, and loading the data:
import matplotlib.pyplot as plt
import numpy as np
import tensorflow as tf

from sklearn import datasets
from tensorflow.python.framework import ops
ops.reset_default_graph()
sess = tf.Session()
iris = datasets.load_iris()
x_vals = np.array([x[3] for x in iris.data])
y_vals = np.array([y[0] for y in iris.data])
2. We then declare our learning rate, batch size, placeholders, and model variables:
learning_rate = 0.05
batch_size = 25

x_data = tf.placeholder(shape=[None, 1], dtype=tf.float32)
y_target = tf.placeholder(shape=[None, 1], dtype=tf.float32)
A = tf.Variable(tf.random_normal(shape=[1,1]))
b = tf.Variable(tf.random_normal(shape=[1,1]))
#data-science #artificial-intelligence #neural-networks #machine-learning #tensorflow