Kmeans is a widely used clustering tool for analyzing and classifying data. Often times, however, I suspect, it is not fully understood what is happening under the hood. This isn’t necessarily a bad thing if you understand what the end product conveys, but learning what happens by building the algorithm from scratch can certainly lead to a deeper understanding of the reasoning behind it.
I
want to start out by emphasizing that the internet is an excellent place for coders and engineers. Answers and resources are widely available and merely a Google search away. To pretend I figured all of this out on my own would be silly. I readily acknowledge that there are times that it takes reading through others’ work on algorithms to understand how to approach it better. The beauty of code is that it can be written in many different ways, each emphasizing a slightly different quality. Utilize that in your learning.
Now that I’ve touched on that point, let’s dive in!
**K Means Clustering **is, in it’s simplest form, an algorithm that finds close relationships in clusters of data and puts them into groups for easier classification.
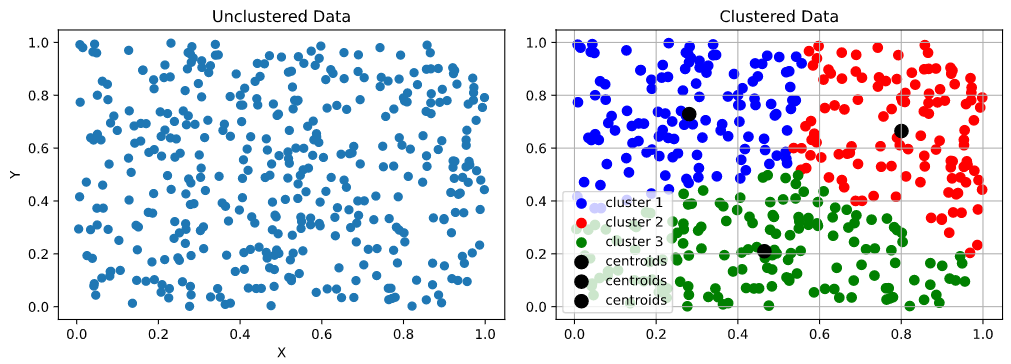
What you see here is an algorithm sorting different points of data into groups or segments based on a specific quality… proximity (or closeness) to a center point.
Most often, Scikit-Learn’s algorithm for KMeans, which looks something like this:
from sklearn.cluster import KMeans

km = KMeans(
       n_clusters=3, init='random',
       n_init=10, max_iter=300,
       random_state=42
       )
y_km = km.fit_predict(X)
You may not understand the parts super well, but it’s fairly simple in its approach. What it basically does is it says we want 3 clusters, start with 10 iterations (or run-throughs, each one refining the clusters and positions), initialization for the 3 center points is random, maximum iterations is 300, and random state just means every time we run it, it will be the same. We then run the prediction. More can be read here on the different parameters that can be used.
So, how do we go about creating this code from scratch… especially if we’re not sure what’s going on? Let’s figure it out!
#data-science #python #data-visualization #k-means-clustering #clustering