When conducting statistical analysis, especially during experimental design, one practical issue that one cannot avoid is to determine the sample size for the experiment. For example, when designing the layout of a web page, we want to know whether increasing the size of the click button will increase the click-through probability. In this case, AB testing is an experimental method that is commonly used to solve this problem.
Moving to the details of this experiment, you will first decide how many users I will need to assign to the experiment group, and how many we need for the control group. The sample size is closely related to four variables, standard error of the sample, statistical power, confidence level, and the effect size of this experiment.
In this article, we will demonstrate their relationships with the sample size by graphs. Specifically, we will discuss different scenarios with one-tail hypothesis testing.
Standard Error and Sample Size
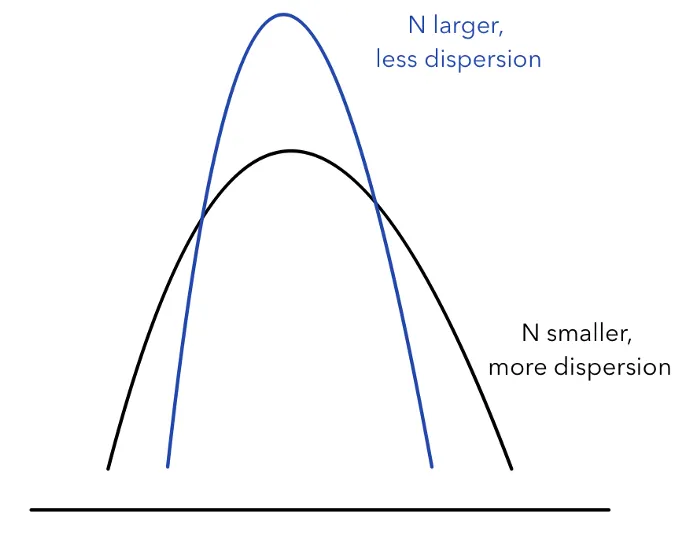
The standard error of a statistic corresponds with the standard deviation of a parameter. Since it is nearly impossible to know the population distribution in most cases, we can estimate the standard deviation of a parameter by calculating the standard error of a sampling distribution. The standard error measures the dispersion of the distribution. As the sample size gets larger, the dispersion gets smaller, and the mean of the distribution is closer to the population mean (Central Limit Theory). Thus, the sample size is negatively correlated with the standard error of a sample. The graph below shows how distributions shape differently with different sample sizes
#statistics #statistical-power #statistical-analysis #data-science #sample-size