A large majority of datasets in the real world contain missing data. This leads to an issue since most Python machine learning models only work with clean datasets. As a result, analysts need to figure out how to deal with the missing data before proceeding on to the modeling step. Unfortunately, most data professionals are mainly focused on the modeling aspect and they do not pay much attention to the missing values. They usually either just drop the rows with missing values or rely on simple data imputation (replacement) techniques such as mean/median imputation. Such techniques can negatively impact model performance. This is where the Autoimpute library comes in — it provides you a framework for the proper handling of missing data.
Types of imputation
- Univariate imputation: Impute values using only the target variable itself, for example, mean imputation.
- Multivariate imputation: Impute values based on other variables, such as, using linear regression to estimate the missing values based on other variables.
- Single imputation: Impute any missing values within the dataset only once to create a single imputed dataset.
- Multiple imputation: Impute the same missing values within the dataset multiple times. This basically involves running the single imputation multiple times to get multiple imputed datasets (explained with a detailed example in the next section).
Using Autoimpute
Now let’s demonstrate how to tackle the issue of missingness using the Autoimpute library. This library provides a framework for handling missing data from the exploration phase up until the modeling phase. The image below shows a basic flowchart of how this process works on regression using multiple imputation.
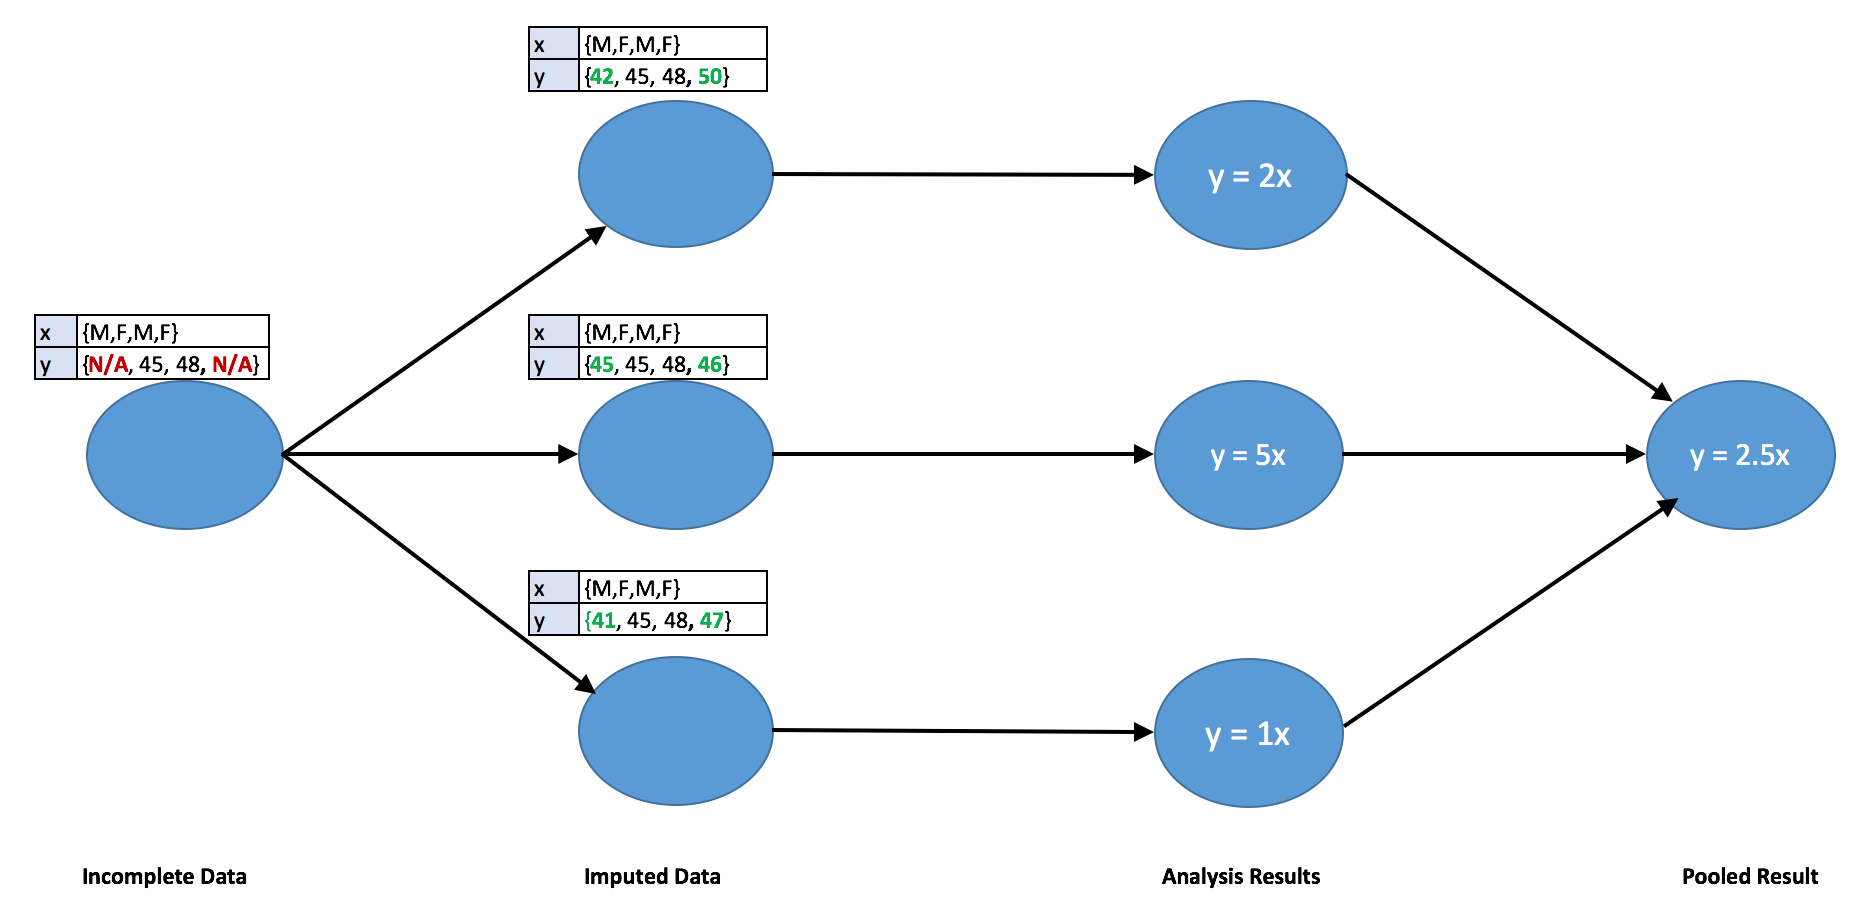
Flowchart demonstrating how multiple imputation works with linear regression.
In the above image, the raw dataset is imputed three times to create three new datasets, each one having its own new imputed values. Separate regressions are run on each of the new datasets and the parameters obtained from these regressions are pooled to form a single model. This process can be generalized to other values of ‘n’ (number of imputed datasets) and various other models.
In order to understand one major advantage of obtaining multiple datasets, we must keep in mind that the missing values are actually unknown and we are not looking to obtain the exact point estimates for them. Instead, we are trying to capture the fact that we do not know the true value and that the value could vary. This technique of having multiple imputed datasets containing different values helps in capturing this variability.
Importing Libraries
We’ll start off by importing the required libraries.
import numpy as np
import pandas as pd
import matplotlib.pyplot as plt
from scipy.stats import norm, binom
import seaborn as sns
from autoimpute.utils import md_pattern, proportions
from autoimpute.visuals import plot_md_locations, plot_md_percent
from autoimpute.visuals import plot_imp_dists, plot_imp_boxplots
from autoimpute.visuals import plot_imp_swarm
from autoimpute.imputations import MultipleImputer
The complete code for this article can be downloaded from this repository: https://github.com/haiderwaseem12/Autoimpute
Creating Dummy Dataset
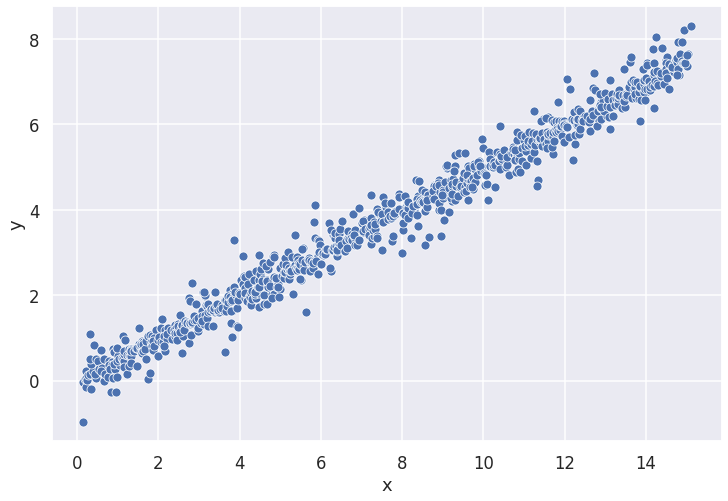
For demonstration purposes, we create a dummy dataset with 1000 observations. The dataset contains two variables; predictor ‘x’ and response ‘_y’. _Forty percent of the observations in ‘_y’ _are randomly replaced by missing values while ‘_x’ _is fully observed. The correlation between ‘_x’ _and ‘_y’ is approximately0.8. _A scatter plot of the data is shown below.
#python #data-visualization #data-science #data-imputation #missing-data #data analysis