There is no shortage of ways out there that we can use to analyze and make sense of textual data. Such methods generally deal with an area of artificial intelligence called Natural Language Processing (NLP).
NLP allows us to perform a multitude of tasks where our data consists of text or speech. Sentiment analysis, machine translation, and information retrieval are just a few examples of NLP applications, many of which we use daily. Today, many of these tasks can be solved with a great degree of success using a combination of NLP and machine learning techniques.
In this post, I’d like to illustrate one such method, doc2vec, and hopefully provide some basic insight into how it works and how to implement it.
The task
Put simply, given a large number of text documents, we want to be able to:
- Measure how similar the documents are to each other semantically.
- Use this information to cluster the documents based on their similarities.
What we’ll cover
I realize this is a longer post. So before we get started, here’s an outline of everything we’ll cover:
- Introducing the dataset
- An overview of doc2vec and vector representations
- Training the doc2vec models
- Visualizing the generated document vectors
- Evaluating the models
Feel free to read it at whatever pace feels comfortable to you. I even encourage you to break it up into parts and read it over multiple sessions as you see fit to stay engaged.
The data
For the purpose of training and testing our models, we’re going to be using the 20Newsgroups data set. This data set consists of about 18000 newsgroup posts on 20 different topics:
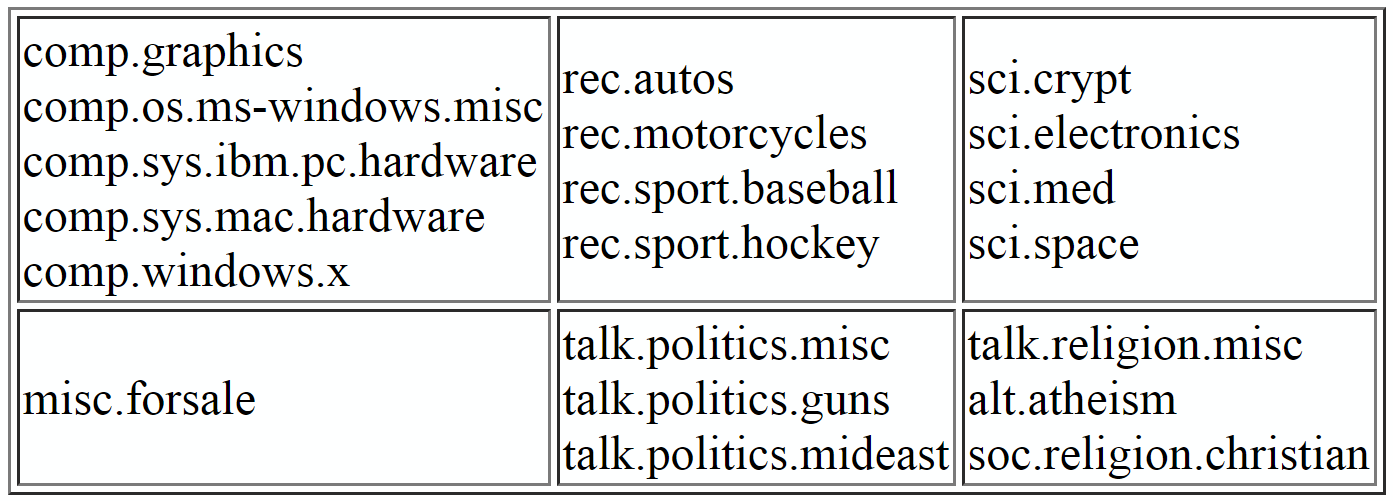
Structure of the 20Newsgroups data set
To speed up training and to make our later evaluation clearer, we limit ourselves to four categories. Also, to ensure that these categories are as distinct as possible, the four categories are chosen such that they don’t belong to the same partition.
For example, this would mean that instead of picking rec.sport.baseball and rec.sport.hockey, we might want to replace one of them with, say, soc.religion.christian. Here, I decided to go with the categories soc.religion.christian, sci.space, talk.politics.mideast, and rec.sport.baseball.
Having chosen the categories, their documents are split into training and test sets, while keeping track of which documents belong to which category in order to make it easier to judge the models’ performance later.
In Python we can use sklearn to get the data:
from sklearn import datasets categories = ["soc.religion.christian", "sci.space", "talk.politics.mideast", "rec.sport.baseball"]cat_dict = {} # Contains raw training data organized by categorycat_dict_test = {} # Contains raw test data organized by categoryfor cat in categories: cat_dict[cat] = datasets.fetch_20newsgroups(subset='train', remove=('headers', 'footers', 'quotes'), categories=[cat]).data cat_dict_test[cat] = datasets.fetch_20newsgroups(subset='test', remove=('headers', 'footers', 'quotes'), categories=[cat]).data
Organizing training and test data by category
Basically, what we’re doing is creating two dictionaries each with 4 keys (i.e. the 4 categories). Each key contains as its value all the documents belonging to that category, where one dictionary contains training documents and the other contains test documents. Furthermore, the parameter remove=('headers', 'footers', 'quotes') removes metadata such as headers, footers, and quotes from the documents in order to prevent our models from overfitting to them.
#data-science #python #machine-learning #visualization #nlp #doc2vec