Introduction to the Object Oriented Method
The idea here is to use a more formal Object Oriented method to create figure objects and then call the respective methods or attributes of that object. This proves to be a _wonderful _practice when dealing with multiple plots.
We will now begin by creating a figure instance. Then we will add axes to that figure.
# Object oriented method
# Create Figure (empty canvas)
fig = plt.figure()

# Add set of axes to figure
axes = fig.add_axes([0.1, 0.1, 0.8, 0.8]) # left, bottom, width, height (range 0 to 1)
# Plot on that set of axes
axes.plot(x, y, 'b')
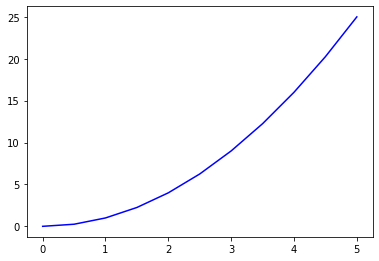
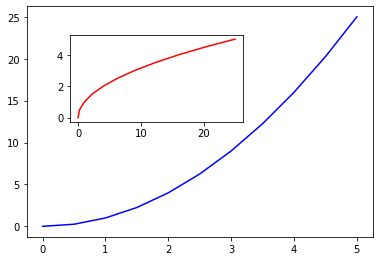
**NOTE : **We did the same thing using plt.plot(x,y) in part 1 of this tutorial. But now using this Object Oriented approach we are going to have a lot more control over our fig object and we can easily add more than one axes to our figure as shown below.
# Creates blank canvas
fig = plt.figure()

axes1 = fig.add_axes([0.1, 0.1, 0.8, 0.8]) # main axes
axes2 = fig.add_axes([0.2, 0.5, 0.4, 0.3]) # inset axes
# Larger Figure Axes 1
axes1.plot(x, y, 'b')
# Insert Figure Axes 2
axes2.plot(y, x, 'r')
Subplots()
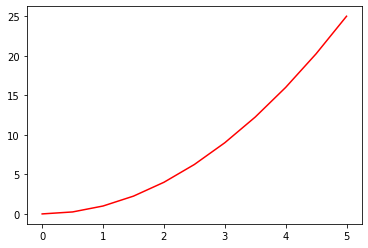
Now we are going to learn how to create subplots using the same object-oriented approach. Subplot is different because we can specify the number of rows and columns.
The plt.subplots() object acts as a more automatic axis manager.
Basic use cases:
# Use tuple unpacking to grab fig and axes
fig, axes = plt.subplots()

# Use axes object to add stuff to the plot
axes.plot(x, y, 'r')
Now we will specify the number of rows and columns while instantiating the subplots() object:
# Make an empty canvas of 1 by 2 subplots
fig, axes = plt.subplots(nrows=1, ncols=2)
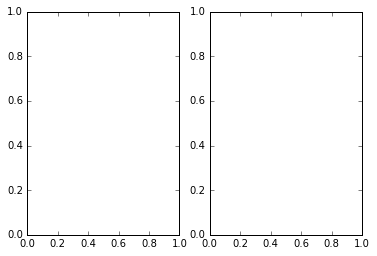
# Axes is an array of axes to plot on
axes
#data-visualisation #matplotlib #data-science-training #data analysis