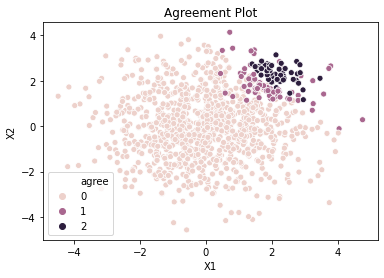
A lot of the most intriguing — to me — use cases for classifications are to identify outliers. The outlier may be a spam message in your inbox, a diagnosis of an extremely rare disease, or an equity portfolio with extraordinary returns. Due to these instances being outliers, it is hard to gather enough data to train a model on how to spot them. Some people dedicate their entire careers to creating strategies to combat imbalanced data. I’ll table those strategies for another blog another day.
Everyone has a strong intuition of what accuracy and error are. This is the same scoring system we used throughout our academic careers. Accuracy is the ratio of correct answers to total questions. Error is the ratio of wrong answers to total questions. These metrics work well for an ideal data set — which doesn’t exist in the real world.
An example of the accuracy paradox is if the there is a 99% chance that a person does not have a particular disease, then a model predicting no one ever has the disease will be 99% accurate.
Calculating Cohen’s kappa statistic by hand
Cohen’s kappa statistic is easy to understand and doesn’t fall victim to the accuracy paradox. Stay with me as I get through the technical jargon. Pₒ is the observed agreement among graders. **Pₑ is the hypothetical chance of the graders arriving at the same answer. **Grader 1 will be your model’s predictions, and grader 2 may be your y_test data (the answer key).

Cohen’s kappa Statistic Formula
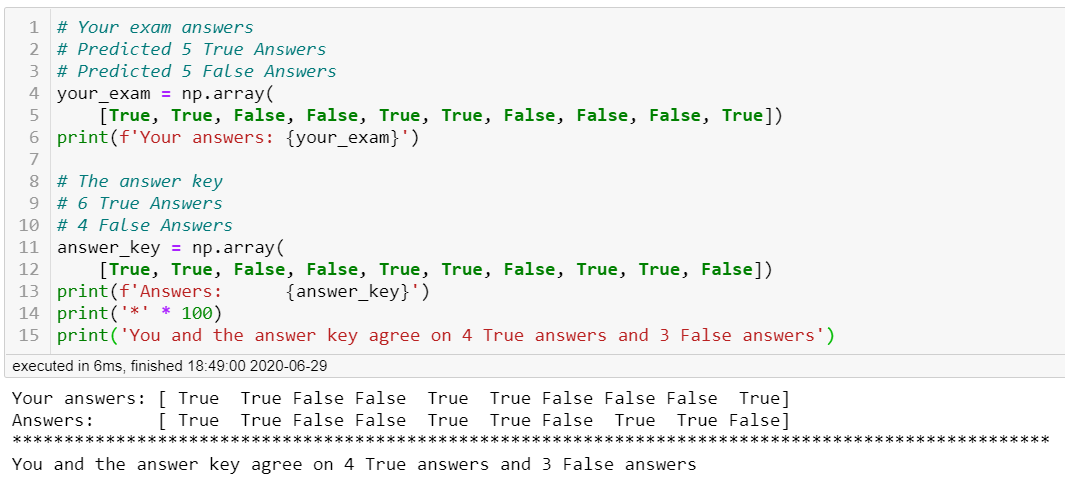
Let’s calculate Cohen’s kappa statistic by hand using a simple example. You scored a 7 out of 10 on an exam with only true and false answers. The teacher has the answer key (the y_test data). To calculate the agreement between your predictions and the answer key we must find Pₒ and Pₑ. First, to find Pₒ we add in the agreement of correct answers.
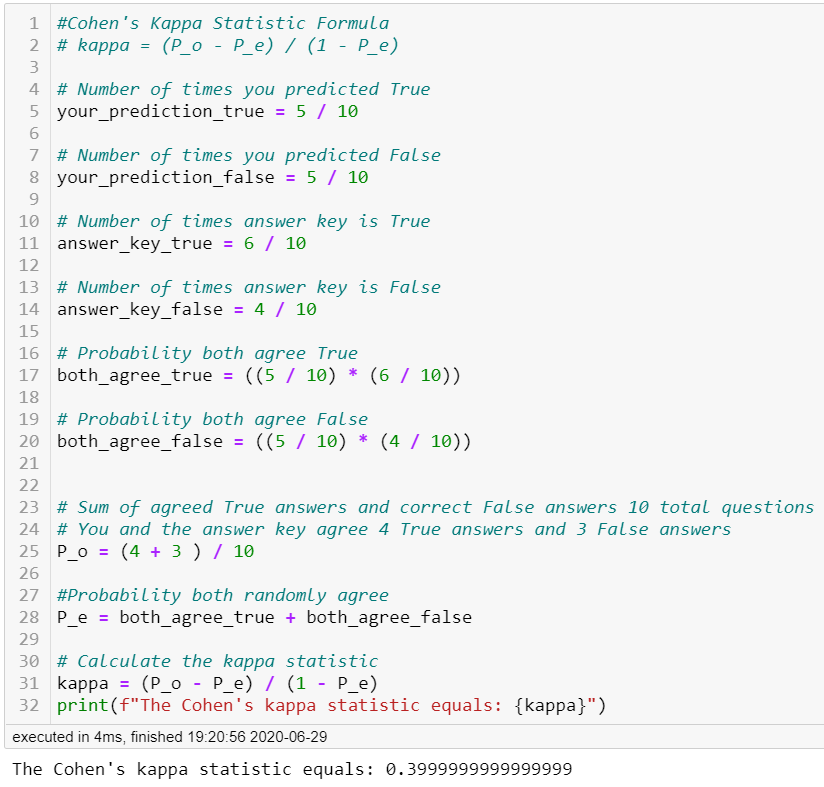
We have now calculated a kappa statistic of 0.4 and Sci-kit learn confirmed the value. The kappa statistic ranges from -1 to 1. The max value of 1 means both graders are in perfect agreement. A value of 0 is equal to the random chance of an agreement. So our value of 0.4 means we are in slight agreement. Depending on the situation this may or may not be acceptable. For example, when determining if a patient has cancer you would want a much higher kappa statistic for the model to be acceptable.
#data-science #statistics #machine-learning #python #supervised-learning