Photo by Carlos Muza on Unsplash
Learning to build complete visualizations in R is like any other data science skill, it’s a journey. RStudio’s ggplot2 is a useful package for telling data’s story, so if you are newer to ggplot2 and would love to develop your visualizing skills, you’re in luck. I developed a pretty quick — and practical — guide to help beginners advance their understanding of ggplot2 and design a couple polished, business-insightful graphs. Because early success with visualizations can be very motivating!
This tutorial assumes you have completed at least one introduction to ggplot2, like this one. If you haven’t, I encourage you to first to get some basics down.
By the end of this tutorial you will:
- Deepen your understanding for enhancing visualizations in ggplot2
- Become familiar with navigating the ggplot2 cheat sheet (useful tool)
- Build two original, polished visuals shown below through a simple, step-by-step format

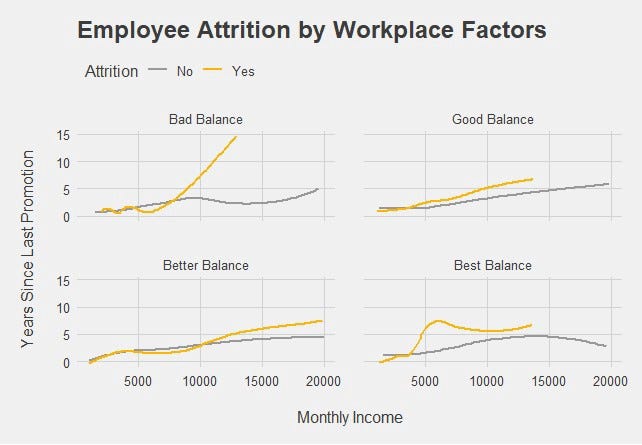
Visualization #2
Before we begin, here are a couple tools that can support your learning. The first is the ‘R Studio Data Visualization with ggplot2 cheat sheet’ (referred to as ‘cheat sheet’ from now on). We will reference it throughout to help you navigate it for future use.
The second is a ‘ggplot2 Quick Guide’ I made to help me build ggplots on my own faster. It’s not comprehensive, but it may help you more quickly understand the big picture of ggplot2.
Let’s go!
For this tutorial, we will use the IBM HR Employee Attrition dataset, available here. This data offers (fictitious) business insight and requires no preprocessing. Sweet!
Let’s install libraries and import the data.
## install libraries
library(ggplot2)
library(scales)
install.packages("ggthemes")
library(ggthemes)
## import data
data <- read.csv(file.path('C:YourFilePath’, 'data.csv'), stringsAsFactors = TRUE)
Then check the data and structure.
## view first 5 rows
head(attrition)

## check structure
str(attrition)
#ggplot2 #rstudio #data-visualization #beginners-guide #visualization