As a trained cognitive neuroscientist, I have experience understanding human behavior and how information guides decisions. Now as I transition into my role as a data scientist, thanks in part to my Data Science Fellowship at Insight, I’ve come to learn of the many other mediums and methods for tracking and understanding behavior on a much larger scale.
During my fellowship, I consulted for Lazy Lantern, a software company that assists other companies to monitor how customers are interacting with their online platforms. More specifically, Lazy Lantern provides its client companies automated monitoring and analytics of their websites and iOS/Android apps which shed light on customer traffic, interactions, and overall behavior on those platforms.
The problem
To understand how Lazy Lantern tracks customer behavior, let’s consider a user journey on a typical retail website, depicted in the figure below.
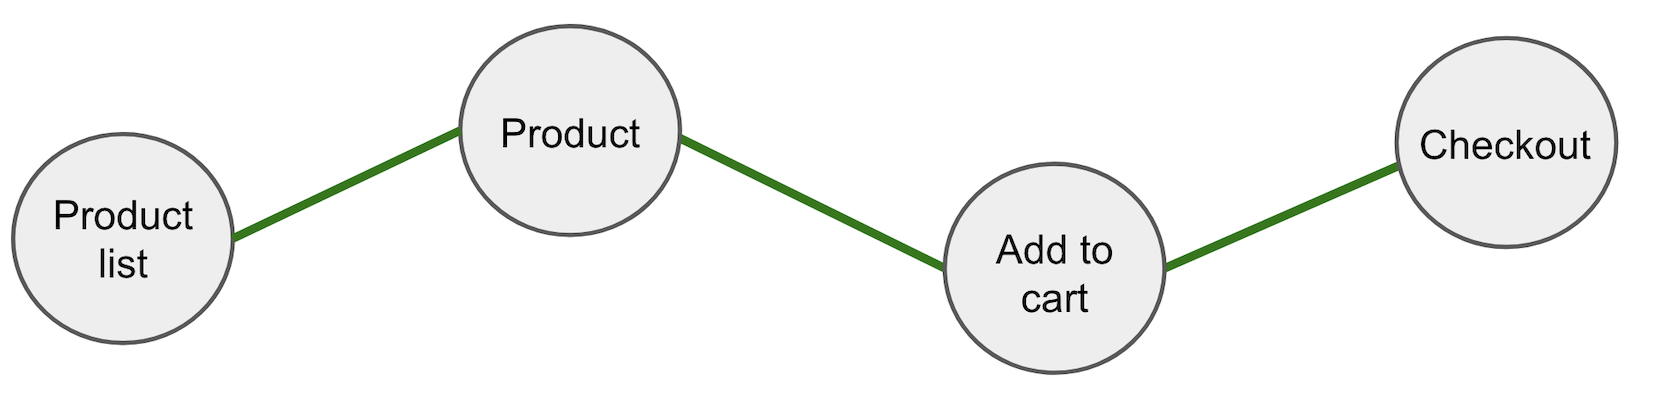
Figure 1. These are the iterative links or events customers typically anticipate clicking through to purchase something on a retail website. [Image by author]
From the homepage, customers might click on the list of products, then hone in on a product of interest, add that product to their cart, and finally check out. Considering that there would be many such customer interactions on a site at a given time, Lazy Lantern uses a time series model, Prophet, to predict the rate of interactions for a given link or event (e.g. product list, product, etc.) on that platform for a given time period. The Prophet model evaluates the expected number of clicks for each of those events on an hourly basis and derives an expected normal range of clicks for a given time period. To learn more about how the Prophet model is used at Lazy Lantern and ways to improve its detection efficiency, check out my Insight colleague Yeonjoo Smith’s blog here.
If the number of customer interactions with these links falls above or below the range predicted by the model, the algorithm triggers an anomaly and the client company is alerted. While this model is able to detect anomalies in rates of user interactions for each of these events individually, it is unable to determine if the triggered anomalies are actually a part of a chain reaction of events on the platform.
For example, let’s consider the same user journey as before, but this time it becomes interrupted, as depicted in the figure below.
#markov-chains #data-science #insight-data-science #anomaly-detection