Tableau has taken the data visualization world by storm, and for good reason. Beautiful and complex visualizations, dashboards, and reports can be created quickly and without any coding experience within its user-friendly interface. Tableau is particularly useful for the creation of interactive visualizations, as filters can be added to a single visualization or full dashboard with just a few clicks. However, Tableau is limited in its analytic capabilities. The calculated fields feature allows for simple measures such as means, sums, and date differences to be calculated, and Tableau has some built-in features for adding regression lines or identifying clustering. For any sort of advanced analyses, however, Tableau falls short.
R, on the other hand, was created by statisticians and therefore has extraordinary analytic capabilities. Between its built-in functions and those contained within the seemingly endless list of available packages, there’s little that you can’t do in R from an analytic standpoint. However, visualization in R presents more of a challenge. The development of packages like ggplot2 and plotly has significantly advanced R’s data visualization abilities, but these packages are still not as easy to use as Tableau’s interface. It takes a fair amount of coding ability to build a well-designed, interactive dashboard or visualization in R. Even for those with coding expertise, it is simply much more time-consuming to write R code to make one plot in a dashboard act as a filter for others, to add explanatory text, to restructure your data for a particular visualization (which often isn’t even necessary in Tableau), to resize graphs in a dashboard, to apply color, or to accomplish any number of other tasks which can be quickly accomplished in Tableau’s drag-and-drop environment.
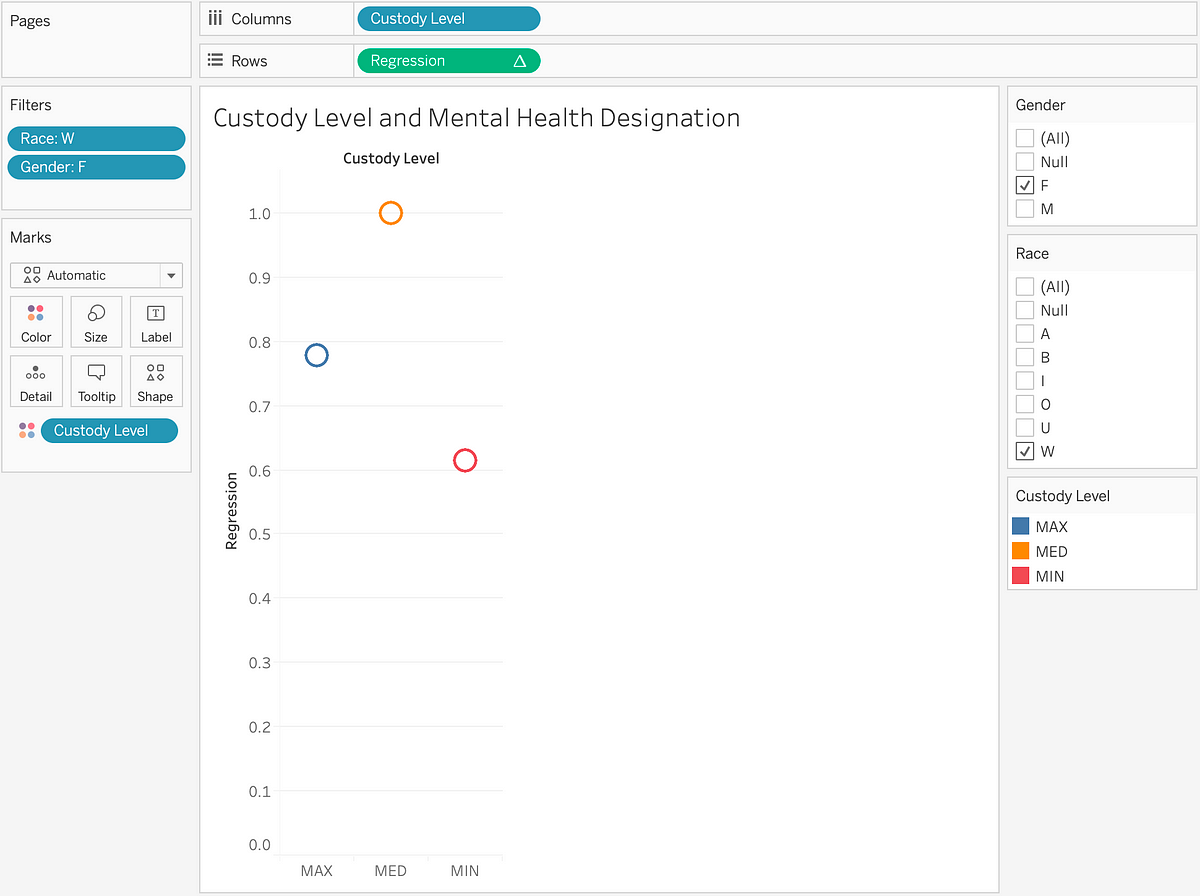
Fortunately, Tableau is able to connect to R, enabling users to reap the benefits of both tools at once. To demonstrate this process and its usefulness, I will walk through a sample regression analysis conducted using R code and Tableau visualizations.
#regression #editors-pick #tableau #data-science #r
