Let’s begin with the most basic but one of the most useful algorithm’s “Linear Regression. A linear regression assumes to model a linear relationship between the input variables (x) and the output variable (y).
A linear regression line has an equation of the form Y = a + bX, where X is the input/explanatory variable and Y is the dependent variable/output. The slope of the line is b, and a is the intercept (the value of y when x = 0).
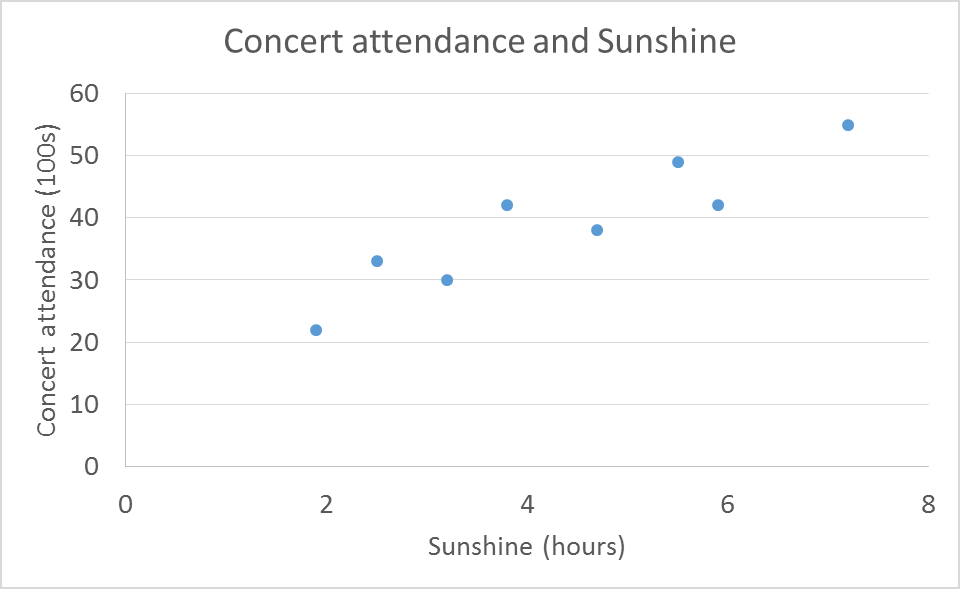
A scatterplot is a helpful tool in determining the strength of the relationship between two variables. If the scatterplot shows no increasing or decreasing trend , then a linear regression model maybe futile . As can be seen in the scatterplot of Concert attendance and weather measured as Sunshine(number of hours) , we can intuitively observe that there is an increasing trend as the number of hours of sunshine increases.
#regression #machine-learning #deep-learning