Data analysis does not have to be hard science. Practitioners often talk about looking at data like it is some sort of secret that is exclusive to well-versed practitioners. Today I will show you how you can use Microsoft Excel to analyze price change occurrence. Of course, we could do it in a couple of lines of code using Python or some other high-level language. However, here you will get to understand what goes behind those lines — and the libraries that you import and use there.
You can either read along or use this post as a tutorial. Either way, I hope it can be intuitive and fun. I will be modelling the price changes of the S&P500 (SPY) composite index. That is, I will be showing you the distribution of percentage change of the SPY over the years.
Analyzing SPY with Excel
To start, I will download historical data about the SPY from Yahoo Finance. To exactly reproduce this experiment, you will need to use data from January 28th, 1993 to October 3rd, 2020, you can download data here. If you use data from other sources or other periods, you might obtain slightly different results.
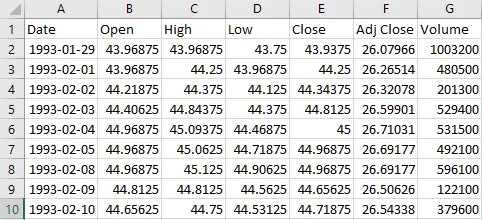
Screenshot of the SPY data in Excel
After opening the .csv file that you just downloaded, your data should look like the one in the image on the left. We will only use one field from this data: Adj Close. Feel free to delete columns A, B, C, D, E, and G by clicking on the header and clicking delete.
The next step is to calculate the percentual price change ®. The formula to do so is R = (Close-Open)/Open.
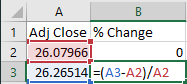
Excel implementation of percentual price change
I have included the excel formula in the image on the left. In lay terms, we are calculating how much the price changed from yesterday to today.
Reproduce your formula for the whole column B, calculating the values for 6971 days of data that we have collected. Next, we will identify the unique values contained in the collection of changes that we have just computed. We will copy and paste the whole of column B into column E, and we will use the “Remove duplicates” tool, under the Data menu.
#data-science #data-analysis #money #statistics #excel