Granger causality test is used to determine if one time series will be useful to forecast another variable by investigating causality between two variables in a time series. The method is a probabilistic account of causality; it uses observed data sets to find patterns of correlation. One good thing about time series vector autoregression (VAR) is that we could test ‘causality’ in some sense. This test is first proposed by Granger (1969), and therefore we refer to it as the Granger causality.
Simple Mechanism to define Granger Causality:
It is based on the idea that if X causes Y, then the forecast of Y based on previous values of Y AND the previous values of X should best result in the forecast of Y based on previous values of Y alone.
Granger causality should not be used to test if a lag of Y causes Y. Instead, it is generally used on exogenous (not Y lag) variables only. In simple terms ‘X is said to Granger-cause Y if Y can be better predicted using the histories of both X and Y than it can by using the history of Y alone’
When performing Granger Causality Test we need to consider two assumptions:
- Future values cannot cause the past values.
- A notably distinct information is contained in **cause **about effect which will not be available elsewhere
_Python implementation of __statsmodel _package for the Granger test.
Lets do the code:
import pandas as pd
import numpy as np
import matplotlib
import seaborn as sns
import random
import matplotlib.pyplot as plt
from dateutil.parser import parse
from scipy import signal
from scipy.interpolate import interp1d
from scipy import stats
from statsmodels.tsa.stattools import adfuller, kpss, acf, pacf, grangercausalitytests
from statsmodels.nonparametric.smoothers_lowess import lowess
from statsmodels.tsa.seasonal import seasonal_decompose
from statsmodels.graphics.tsaplots import plot_acf, plot_pacf
from sklearn.metrics import mean_squared_error
%matplotlib inline
## Upload Data in a DataFrame
df = pd.read_csv('IxR_Data.csv', parse_dates=['Value_Date'])
df.set_index(['Value_Date'])
## Get few records
df.head()

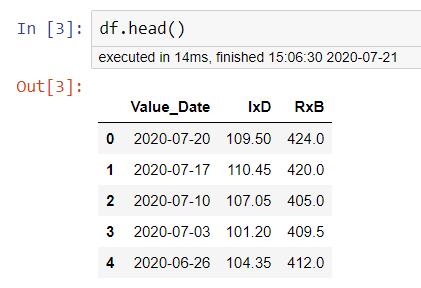
We will do some EDA …. Not relevent at this to show here. But Just wanted to show you that how the series are behaving in data time series
ax = sns.lineplot(x="Value_Date", y="IxD", data=df)
ax1 = sns.lineplot(x="Value_Date", y='RxB', data=df)

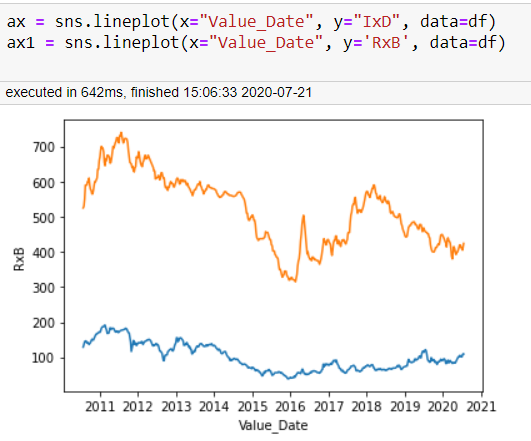
We can see from the above chart that both _Time Series _move (_not so) _simultaneously, and lead to the inter relationship can be use for the prediction of any variable.
#var #model #granger #granger-causality #causality
