What is a convolution? OK, that’s not such a simple question. Instead, I am will give you a very basic example and then I will show you how to do this in Python with actual functions.
So, suppose you have an object and a camera. The object is the Sun — which produces different frequencies of light at different intensities. You could consider this frequency distribution of intensities a function (I’m going to call this function f). Next, you have a camera. The camera isn’t perfect. It is more sensitive to different frequencies of light. I’ll call this camera frequency sensitivity the function g.
When you capture an image of the Sun with this camera, you get some data. That data shows the intensity of different frequencies of light — but this data depends on both the Sun (function f) AND the camera (function g). The data you get would be the convolution of f and g.
OK, I’m not sure if that’s the best example of a convolution — but I’m going to move forward anyway. Actually, I’ve seen this awesome animation of a convolution and I think it helps explain the thing. I’ll go through the steps to make this down below.
In this case, the red curve is one function and the blue is the other one. You can think of the convolution and as the area of amount the two functions overlap. So, as the two functions start to overlap the area in common increases up to the point where they are exactly on top of each other. Then the convolution starts to decrease as they are no longer completely overlapping.
Fine. But how do you calculate this stuff? One way to define the convolution is with the following integral.
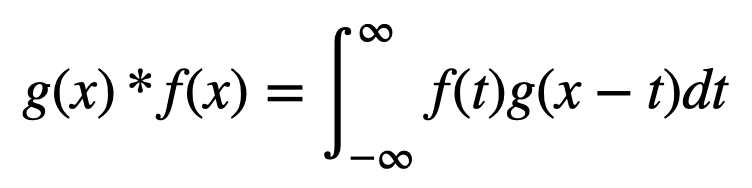
Note that this is an integral over the variable _t, _but you get the convolution as a function of x. You can think of the t parameter as the part that moves the two functions over each other.
But since this is just an integral, it should be fairly straightforward to calculate this as a numerical sum. The basic idea is to take tiny steps along the axis (it would technically be t-axis) and calculate the size of the rectangle that as a width of _dt _(the step size) and a height of the product of functions. Here is a post with ALL of the details of a numerical integration.
Numerical Calculation of a Convolution
Let’s start with the convolution of the two square functions show above in the animation. Here’s the plan.
- Define the two functions. I’m going to do this by making the function a python function.
- Define a function that determines the integral of the product of these two functions for a particular value of x. This will just be a normal numerical integral and return just one number — but this will be the convolution value.
- Finally, just move to a new x-value and calculate the convolution number again. All of these convolution numbers will be the convolution function (which I will plot).
Oh, I guess I should also put this python graphing tutorial here — just in case.
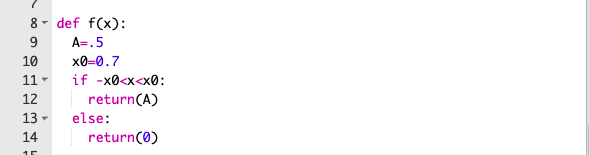
OK, but here is the code for the first function — f(x). Full program is here.
#physics #python