We live in the era of big data. We collect lots of data which allows to infer meaningful results and make informed business decisions. However, the raw data does not offer much unless it is processed and explored. In order to make the most out of raw data, we need a thorough exploratory data analysis process. Even if we build complex, well-structured machine learning models, we cannot just dump the raw data to them. The models get as good as the data we feed to them. As the amount of data increases, it gets trickier to analyze and explore the data. There comes in the power of data analysis and visualization tools.
We will explore a dataset on flight delays which is available here on Kaggle. There are two datasets, one includes flight details in Jan 2019 and the other one in Jan 2020. In this post, we will use the one in Jan 2019. We start with importing the dataset into a pandas dataframe.
import numpy as np
import pandas as pd
df = pd.read_csv("/content/Jan_2019_ontime.csv")
print(df.shape)
df.columns

The dataset contains information on more than 500k flights (rows) and 22 features (columns) on each flight. Some of the columns seem redundant or kind of recurring so we will include some of the columns in our analysis.
df = df[[‘DAY_OF_MONTH’, ‘DAY_OF_WEEK’, ‘OP_CARRIER_AIRLINE_ID’, ‘ORIGIN’, ‘DEST’,‘DEP_TIME’, ‘DEP_DEL15’, ‘ARR_TIME’, ‘ARR_DEL15’, ‘CANCELLED’, ‘DIVERTED’, ‘DISTANCE’]]
df.head()
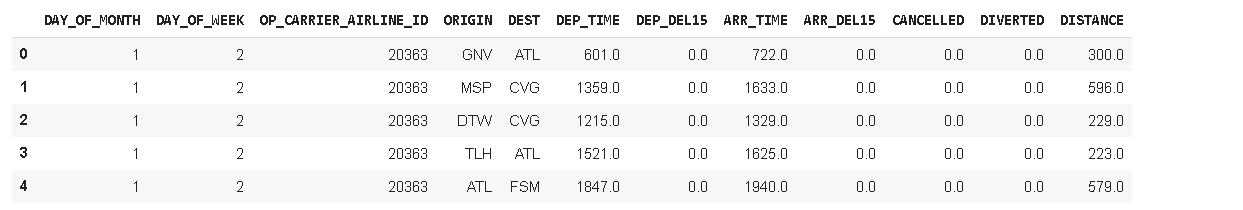
For each flight, the following features are available:
- Day of the month
- Day of the week
- Carrier airline (
- Departure city and departure time (ORIGIN, DEP_TIME)
- Arrival city and arrival time (DEST, ARR_TIME)
- Delayed on departure and arrival (DEP_DEL15, ARR_DEL15)
- Cancelled, Diverted
- Distance
Missing values
We first handle missing values. As a first step, let’s check the number of missing values in each column.
df.isna().sum()

We have missing values in 4 columns. The number of missing values are close so they might be in the same rows. To confirm, we can visualize missing values using **missingno **module.
%matplotlib inline
import missingno as msno
msno.matrix(df)

White lines indicate missing values. Most of the missing values in those 4 columns are in the same rows. The rows with missing values might belong to cancelled or diverted flights. Let’s check “CANCELLED” and “DIVERTED” columns before handling missing values.

The number of cancelled flights is approximately the same as the number of missing values in columns about flight information.#artificial-intelligence #machine-learning #data-analysis #data-science #data analysis #data analysis