Best Python libraries for Machine Learning
Best Python libraries for Machine Learning - An expanded list of best Python libraries for data science with a fresh look to the ones … With its help, you can implement many machine learning methods and …
Machine Learning, as the name suggests, is the science of programming a computer by which they are able to learn from different kinds of data. A more general definition given by Arthur Samuel is – “Machine Learning is the field of study that gives computers the ability to learn without being explicitly programmed.” They are typically used to solve various types of life problems.
In the older days, people used to perform Machine Learning tasks by manually coding all the algorithms and mathematical and statistical formula. This made the process time consuming, tedious and inefficient. But in the modern days, it is become very much easy and efficient compared to the olden days by various python libraries, frameworks, and modules. Today, Python is one of the most popular programming languages for this task and it has replaced many languages in the industry, one of the reason is its vast collection of libraries. Python libraries that used in Machine Learning are:
NumpyScipyScikit-learnTheanoTensorFlowKerasPyTorchPandasMatplotlib
Numpy

NumPy is a very popular python library for large multi-dimensional array and matrix processing, with the help of a large collection of high-level mathematical functions. It is very useful for fundamental scientific computations in Machine Learning. It is particularly useful for linear algebra, Fourier transform, and random number capabilities. High-end libraries like TensorFlow uses NumPy internally for manipulation of Tensors.
# Python program using NumPy
# for some basic mathematical
# operations

import numpy as np

# Creating two arrays of rank 2
x = np.array([[1, 2], [3, 4]])
y = np.array([[5, 6], [7, 8]])

# Creating two arrays of rank 1
v = np.array([9, 10])
w = np.array([11, 12])

# Inner product of vectors
print(np.dot(v, w), "\n")

# Matrix and Vector product
print(np.dot(x, v), "\n")

# Matrix and matrix product
print(np.dot(x, y))
Output:
219

[29 67]

[[19 22]
 [43 50]]
For more details refer to Numpy.
SciPy

SciPy is a very popular library among Machine Learning enthusiasts as it contains different modules for optimization, linear algebra, integration and statistics. There is a difference between the SciPy library and the SciPy stack. The SciPy is one of the core packages that make up the SciPy stack. SciPy is also very useful for image manipulation.
# Python script using Scipy
# for image manipulation

from scipy.misc import imread, imsave, imresize

# Read a JPEG image into a numpy array
img = imread('D:/Programs / cat.jpg') # path of the image
print(img.dtype, img.shape)

# Tinting the image
img_tint = img * [1, 0.45, 0.3]

# Saving the tinted image
imsave('D:/Programs / cat_tinted.jpg', img_tint)

# Resizing the tinted image to be 300 x 300 pixels
img_tint_resize = imresize(img_tint, (300, 300))

# Saving the resized tinted image
imsave('D:/Programs / cat_tinted_resized.jpg', img_tint_resize)
For more details refer to documentation.
Scikit-learn

Skikit-learn is one of the most popular ML libraries for classical ML algorithms. It is built on top of two basic Python libraries, viz., NumPy and SciPy. Scikit-learn supports most of the supervised and unsupervised learning algorithms. Scikit-learn can also be used for data-mining and data-analysis, which makes it a great tool who is starting out with ML.
# Python script using Scikit-learn
# for Decision Tree Clasifier

# Sample Decision Tree Classifier
from sklearn import datasets
from sklearn import metrics
from sklearn.tree import DecisionTreeClassifier

# load the iris datasets
dataset = datasets.load_iris()

# fit a CART model to the data
model = DecisionTreeClassifier()
model.fit(dataset.data, dataset.target)
print(model)

# make predictions
expected = dataset.target
predicted = model.predict(dataset.data)

# summarize the fit of the model
print(metrics.classification_report(expected, predicted))
print(metrics.confusion_matrix(expected, predicted))
Output:
DecisionTreeClassifier(class_weight=None, criterion='gini', max_depth=None,
            max_features=None, max_leaf_nodes=None,
            min_impurity_decrease=0.0, min_impurity_split=None,
            min_samples_leaf=1, min_samples_split=2,
            min_weight_fraction_leaf=0.0, presort=False, random_state=None,
            splitter='best')
              precision    recall  f1-score   support

           0       1.00      1.00      1.00        50
           1       1.00      1.00      1.00        50
           2       1.00      1.00      1.00        50

   micro avg       1.00      1.00      1.00       150
   macro avg       1.00      1.00      1.00       150
weighted avg       1.00      1.00      1.00       150

[[50  0  0]
 [ 0 50  0]
 [ 0  0 50]]
For more details refer to documentation.
Theano
We all know that Machine Learning is basically mathematics and statistics. Theano is a popular python library that is used to define, evaluate and optimize mathematical expressions involving multi-dimensional arrays in an efficient manner. It is achieved by optimizing the utilization of CPU and GPU. It is extensively used for unit-testing and self-verification to detect and diagnose different types of errors. Theano is a very powerful library that has been used in large-scale computationally intensive scientific projects for a long time but is simple and approachable enough to be used by individuals for their own projects.
# Python program using Theano
# for computing a Logistic
# Function

import theano
import theano.tensor as T
x = T.dmatrix('x')
s = 1 / (1 + T.exp(-x))
logistic = theano.function([x], s)
logistic([[0, 1], [-1, -2]])
Output:
array([[0.5, 0.73105858],
       [0.26894142, 0.11920292]])
For more details refer to documentation.
** TensorFlow**

TensorFlow is a very popular open-source library for high performance numerical computation developed by the Google Brain team in Google. As the name suggests, Tensorflow is a framework that involves defining and running computations involving tensors. It can train and run deep neural networks that can be used to develop several AI applications. TensorFlow is widely used in the field of deep learning research and application.
#  Python program using TensorFlow
#  for multiplying two arrays

# import `tensorflow`
import tensorflow as tf

# Initialize two constants
x1 = tf.constant([1, 2, 3, 4])
x2 = tf.constant([5, 6, 7, 8])

# Multiply
result = tf.multiply(x1, x2)

# Intialize the Session
sess = tf.Session()

# Print the result
print(sess.run(result))

# Close the session
sess.close()
Output:
[ 5 12 21 32]
For more details refer to documentation.
Keras

Keras is a very popular Machine Learning library for Python. It is a high-level neural networks API capable of running on top of TensorFlow, CNTK, or Theano. It can run seamlessly on both CPU and GPU. Keras makes it really for ML beginners to build and design a Neural Network. One of the best thing about Keras is that it allows for easy and fast prototyping.
For more details refer to documentation.
PyTorch

PyTorch is a popular open-source Machine Learning library for Python based on Torch, which is an open-source Machine Learning library which is implemented in C with a wrapper in Lua. It has an extensive choice of tools and libraries that supports on Computer Vision, Natural Language Processing(NLP) and many more ML programs. It allows developers to perform computations on Tensors with GPU acceleration and also helps in creating computational graphs.
# Python program using PyTorch
# for defining tensors fit a
# two-layer network to random
# data and calculating the loss

import torch


dtype = torch.float
device = torch.device("cpu")
# device = torch.device("cuda:0") Uncomment this to run on GPU

# N is batch size; D_in is input dimension;
# H is hidden dimension; D_out is output dimension.
N, D_in, H, D_out = 64, 1000, 100, 10

# Create random input and output data
x = torch.randn(N, D_in, device = device, dtype = dtype)
y = torch.randn(N, D_out, device = device, dtype = dtype)

# Randomly initialize weights
w1 = torch.randn(D_in, H, device = device, dtype = dtype)
w2 = torch.randn(H, D_out, device = device, dtype = dtype)

learning_rate = 1e-6
for t in range(500):
    # Forward pass: compute predicted y
    h = x.mm(w1)
    h_relu = h.clamp(min = 0)
    y_pred = h_relu.mm(w2)

    # Compute and print loss
    loss = (y_pred - y).pow(2).sum().item()
    print(t, loss)

    # Backprop to compute gradients of w1 and w2 with respect to loss
    grad_y_pred = 2.0 * (y_pred - y)
    grad_w2 = h_relu.t().mm(grad_y_pred)
    grad_h_relu = grad_y_pred.mm(w2.t())
    grad_h = grad_h_relu.clone()
    grad_h[h < 0] = 0
    grad_w1 = x.t().mm(grad_h)

    # Update weights using gradient descent
    w1 -= learning_rate * grad_w1
    w2 -= learning_rate * grad_w2
Output:
0 47168344.0
1 46385584.0
2 43153576.0
...
...
...
497 3.987660602433607e-05
498 3.945609932998195e-05
499 3.897604619851336e-05
For more details refer to documentation.
Pandas

Pandas is a popular Python library for data analysis. It is not directly related to Machine Learning. As we know that the dataset must be prepared before training. In this case, Pandas comes handy as it was developed specifically for data extraction and preparation. It provides high-level data structures and wide variety tools for data analysis. It provides many inbuilt methods for groping, combining and filtering data.
# Python program using Pandas for
# arranging a given set of data
# into a  table

# importing pandas as pd
import pandas as pd

data = {"country": ["Brazil", "Russia", "India", "China", "South Africa"],
       "capital": ["Brasilia", "Moscow", "New Dehli", "Beijing", "Pretoria"],
       "area": [8.516, 17.10, 3.286, 9.597, 1.221],
       "population": [200.4, 143.5, 1252, 1357, 52.98] }

data_table = pd.DataFrame(data)
print(data_table)
Output:

For more details refer to Pandas.
Matplotlib

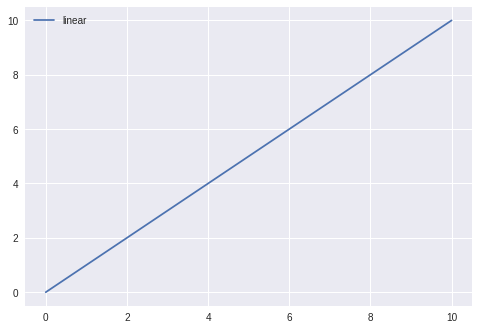
Matpoltlib is a very popular Python library for data visualization. Like Pandas, it is not directly related to Machine Learning. It particularly comes in handy when a programmer wants to visualize the patterns in the data. It is a 2D plotting library used for creating 2D graphs and plots. A module named pyplot makes it easy for programmers for plotting as it provides features to control line styles, font properties, formatting axes, etc. It provides various kinds of graphs and plots for data visualization, viz., histogram, error charts, bar chats, etc,
#  Python program using Matplotib
# for forming a linear plot

# importing the necessary packages and modules
import matplotlib.pyplot as plt
import numpy as np

# Prepare the data
x = np.linspace(0, 10, 100)

# Plot the data
plt.plot(x, x, label ='linear')

# Add a legend
plt.legend()

# Show the plot
plt.show()
Output:

For more details refer to documentation.
#machine-learning #python
