Kibana is a data visualizer tool of ELK. As a beginner of KLK, you have to know this tool inevitably. However, Kibana isn’t the only tool to visualize elasticsearch results. There are many other tools, like as Grafana and others will help you, if you are more familiar with them. In this article, we will step into the world of Kibana, trying to know what is Kibana, and how to use it.
Outline
- Installation and introduction
- What is the Kibana role in ELK system
- Basic operations in Kibana
- Conclusion
What is Kibana?
Kibana is an exploration and visualization tool. You can use it to analyze elasticsearch’s logs or time series data and monitor the specific application. Different from Grafana, Kibana needs to rely on the elasticsearch service. By default, it will listen to the elasticsearch service on port 9200, and start the service on port 5601.(Of course, like as elasticsearch, you can customize these configuration at specific yaml file.)
Installation
- Mac
brew tap elastic/tap
brew install elastic/tap/kibana-full
- Windows
download kibana zip file from this, and unzip it following Kibana tutorial
- Linux
curl -O https://artifacts.elastic.co/downloads/kibana/kibana-7.8.0-linux-x86_64.tar.gz
curl https://artifacts.elastic.co/downloads/kibana/kibana-7.8.0-linux-x86_64.tar.gz.sha512 | shasum -a 512 -c -
tar -xzf kibana-7.8.0-linux-x86_64.tar.gz
What is the role of Kibana in ELK stack?

image credit: https://www.youtube.com/watch?v=gQ1c1uILyKI
Before learning how to use Kibana, I think we must to know why Kibana and what things that Kibana could help us. Base on edurekal’s video, there are three features in Kibana.
First, “enable search and interact with elasticsearch”. We could request elasticsearch RestFulapis with devtools in Kibana. Besides, Kibana also provides us caching our query syntax, that means, even you close your browser without saving, you could use the caching query syntax at the next time. Second, “allow performing advanced analytics and creation of reports”. With Kibana, we could analyze our raw data advanced and discover more data properties which is not focused on by us. Last, **“enable creation and sharing dynamic dashboards that get updated in realtime”. **Undoubtedly, this is the most well-known feature in Kibana.
Basic operations in Kibana
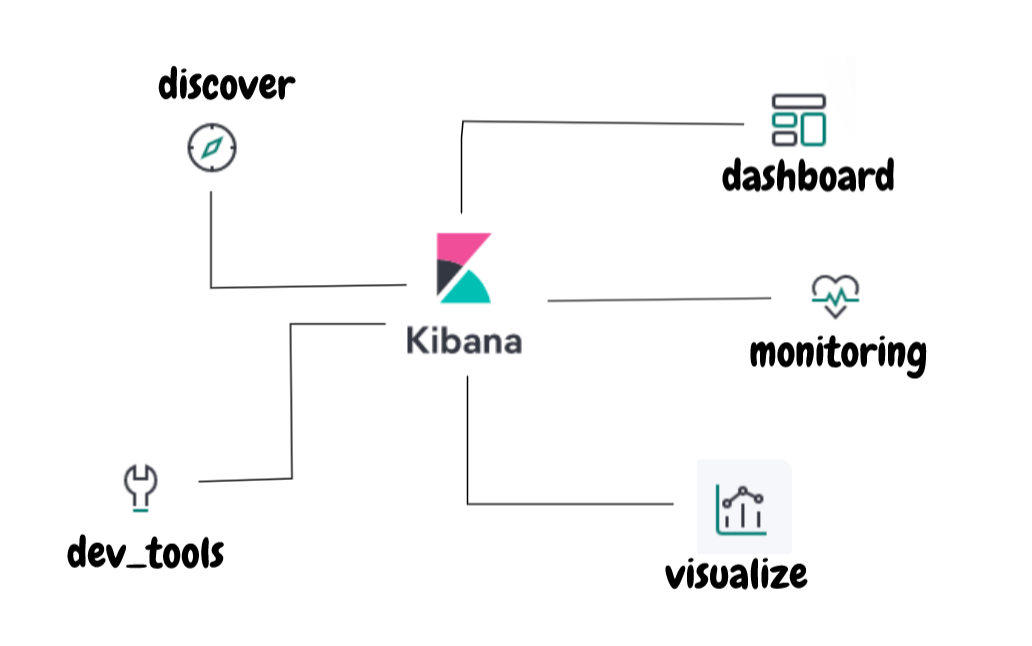
kibana_with_tools
Dev_tools
We could use dev_tools to request elasticsearch apis, and get readable output data from Kibana.

dev_tools_console_call_es apis
- Console: Once opening Kibana dev_tools, two block spaces comes into view. You could call Elasticsearch api at the left side, and the result of requesting will console on the right side. It’s very much like
Postman, right? - Search Profiler: Profile API provided by Elasticsearch makes us to discover the reason of searching inefficiency. However, the output from the Profile API is very verbose. With Kibana, the complex output is translated into readable charts that allow us to more efficiently spot inefficiencies.
- Grok Debugger: We use
grok filterto parse input logs atLogstash. Kibana supports us using the GUI board to test our grok syntax. It will make our debugging time short.
Monitoring
Through Monitoring, we can get an overview of the current status of elasticsearch and Kibana.
- Kibana monitoring displays the information for elasticsearch and Kibana, including version, disk usage, memory usage, index count, shard count, replica count, node count, and so on.

kibana_monitoring
Discover
After setting index patterns from Kibana management, you could find the time distribution of indices, as well as details of each piece of data on Discover board.

Visualize
Visualize make your data visualize, which means translate raw data into various chart you need.
- Kibana provides multiple chart types you need including bar charts, line charts, pie charts, tabular data, map distribution maps, etc. .You can choose based on the type of data you have and the context in which you use it.

kibana_visualisation_add_chart
2. brings the data to life: We could create a nested chart and map with geoips to enrich our charts.

nested_pie_chart
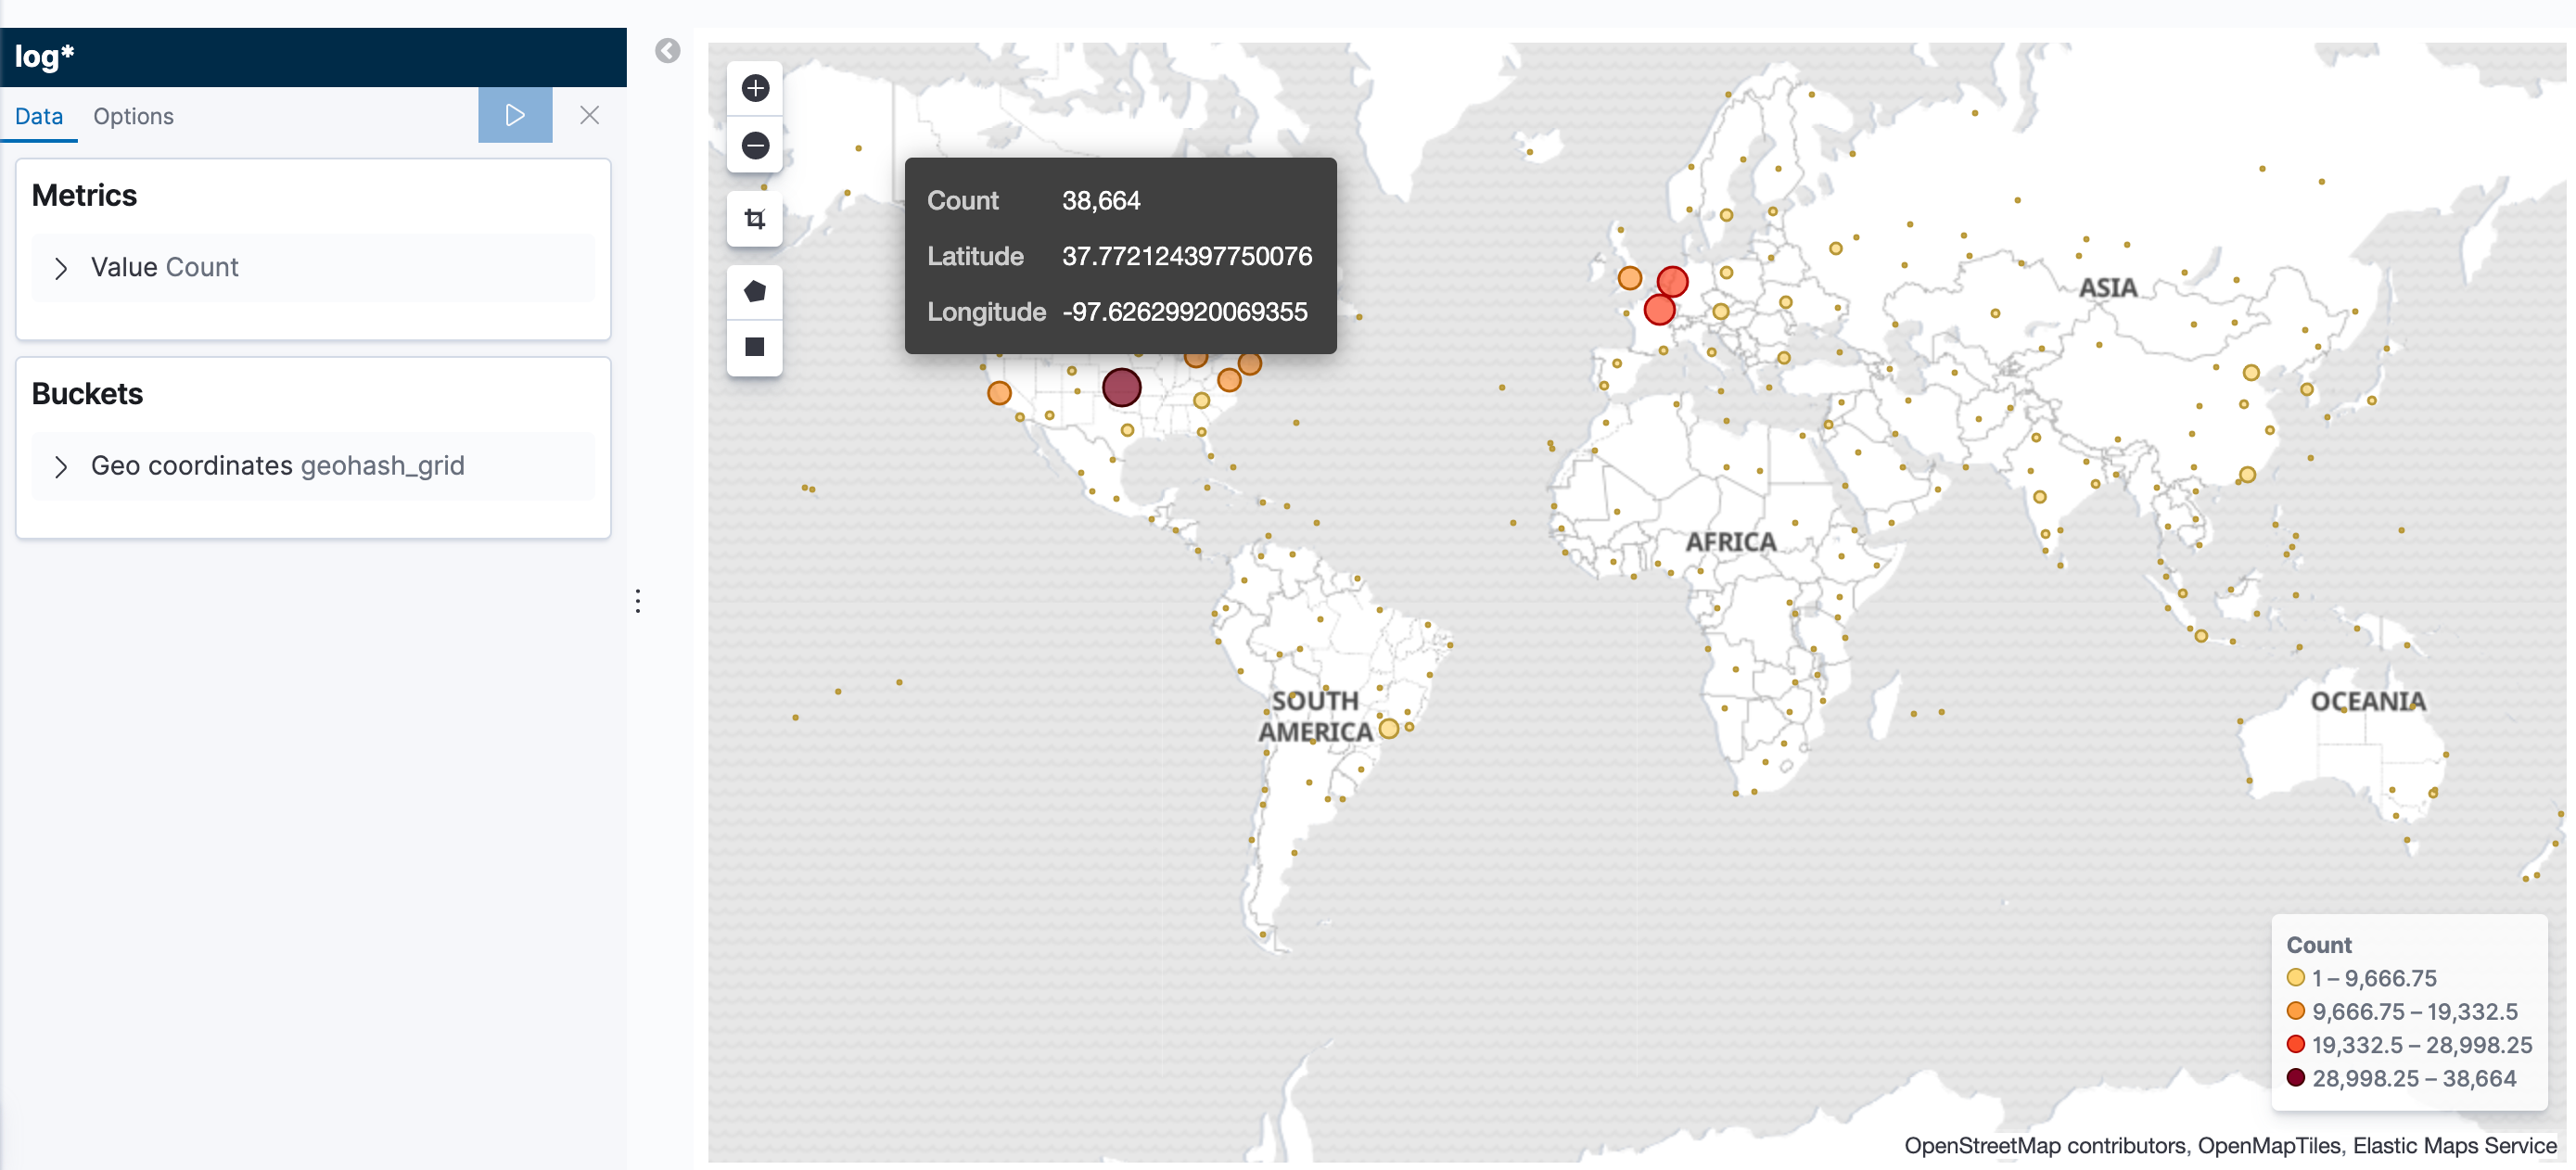
kibana_process_geoips_data
Dashboard
Once adding the visualizeitem to dashboard, no matter when you open the Kibana webpage, you could get real-time data graphes.
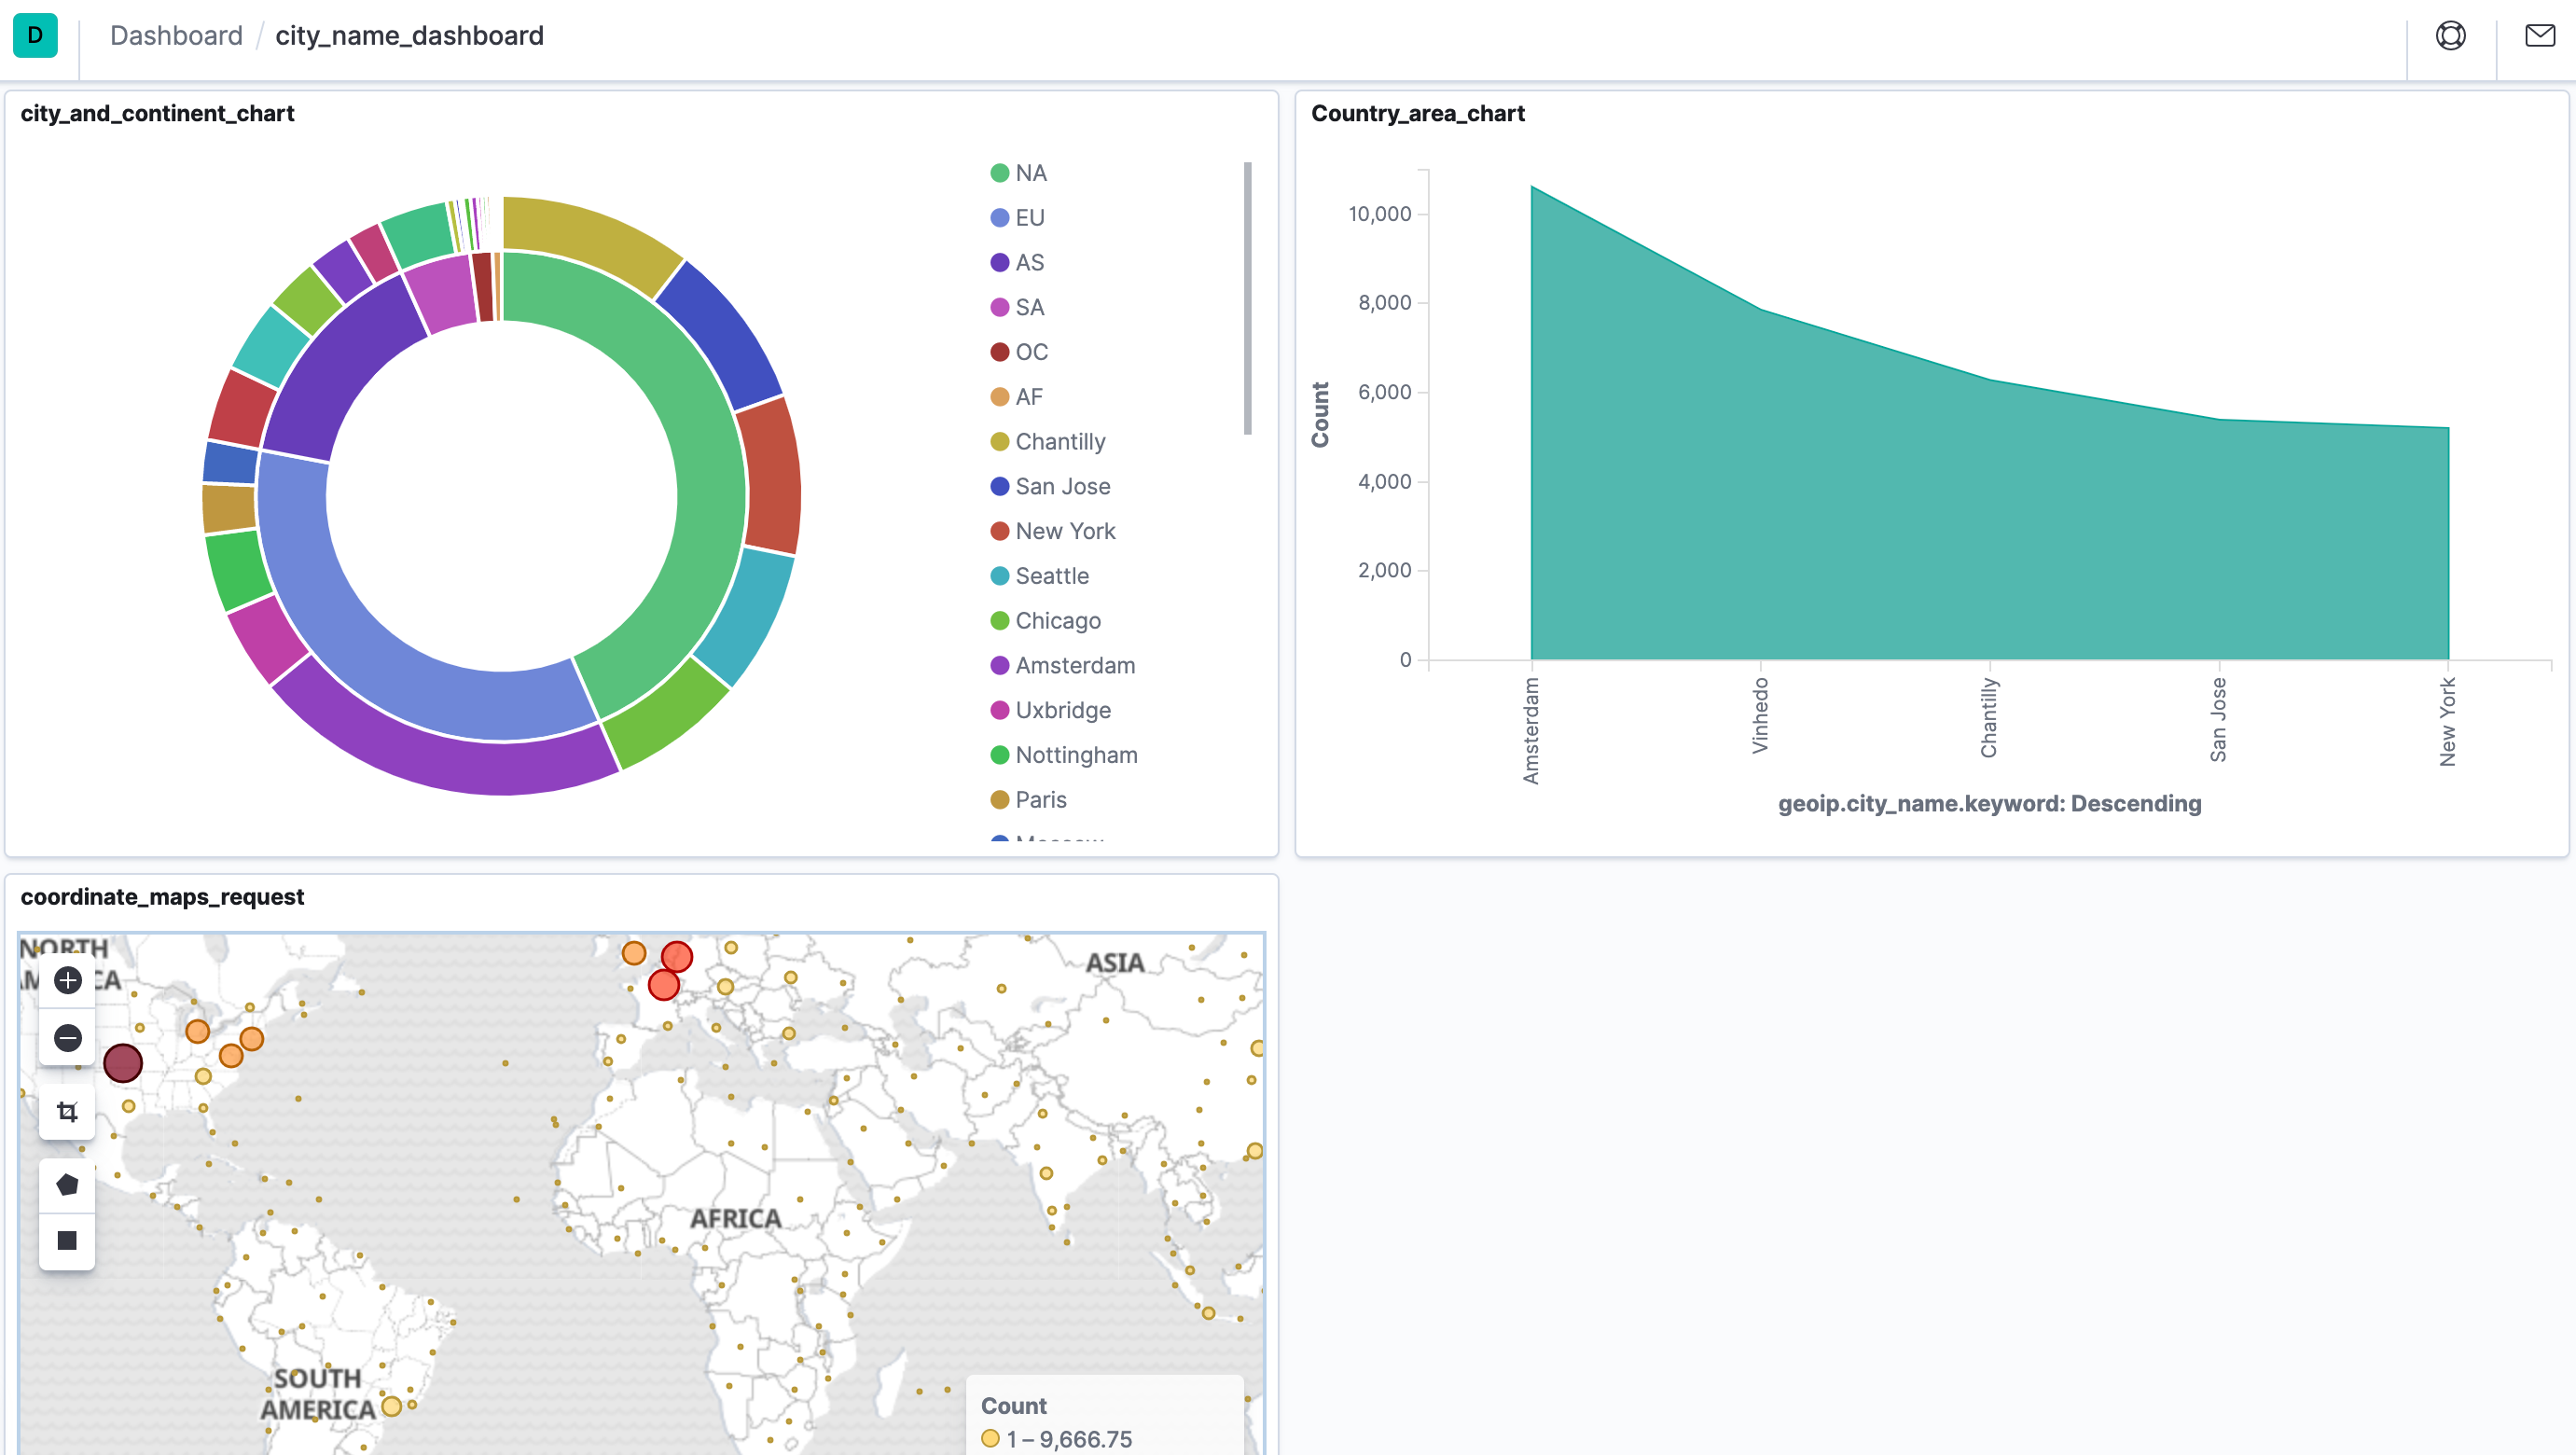
kibana_dashboard_get_realtime_chart
Conclusion
As the visualizer and log analyzer in ELK system, Kibana includes of many functions which is highly compatible with elasticsearch to help us injecting new meaning into raw data. This article just introduce you guys some basic operations; therefore, you could explore other rich functions in Kibana continuously(There are multiple functions at the newest version of Kibana).
This article just share a few of Kibana’s usual features with you. If there is something wrong or defects, please leave a message to me. What’s more, I would mostly welcome your discussion with me at topics of ELK.
#elk-stack #elasticsearch #dashboard #kibana #visualization
