There could be different kind of trends in your data which you know are not related to the actual process of your concern and you want to get rid of it. We can broadly divide them into two classes: Linear trend and **non-linear trend. **Let’s see how to remove these trends.
Linear trend
Let’s first create a dataset that show an unwanted linear trend. Importing required libraries;
import numpy as np
import matplotlib.pyplot as plt
%matplotlib inline
Now let’s put a few lines to keep the figure sizes constant throughout.
plt.rcParams["font.size"] = 16
plt.rcParams['figure.figsize'] = (20, 10)
Let’s create a dataset of 1000 time points. Here I use the cumulative sum, cumsum(), of 1000 random points from a normal distribution to make it look more like a real dataset. I am adding a linear increase to it from -50 to 50.
#create signal
n = 1000
signal1 = np.cumsum(np.random.randn(n)) + np.linspace(-50,50, n)

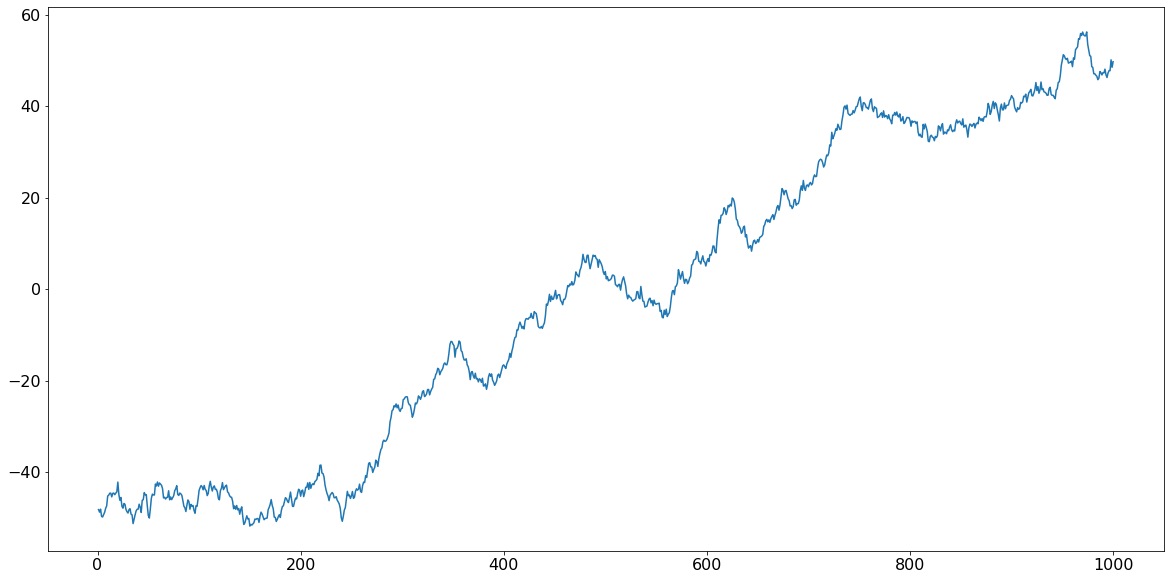
So, if your time series looks like this, then depending on your knowledge of experimental conditions, perhaps you want to focus on the local changes. The fact that all these points are and kind of going up might come from some artefact and you want to get rid of this before proceeding further down analysis.
Now in the signal processing toolbox of the scipy module we already have a defined function detrend to do the job for us. So let’s import it.
#python #data-science #data-analysis #science