Monitoring Microservices Performance with Aggregated Trace Metrics
It’s no secret that Jaeger and OpenTelemetry are known and loved by the open source community — and for good reason. As part of the Cloud Native Computing Foundation (CNCF), they offer one the most popular open source distributed tracing solutions out there as well as standardization for all telemetry data types.
Jaeger, which is in the graduated phase within the CNCF, helps thousands of engineers track and measure requests and transactions by analyzing end-to-end data from service call chains so they can better understand latency issues in microservice architectures. However since Jaeger only enables engineers to search for and analyze individual traces, it offers just a glimpse of the picture.
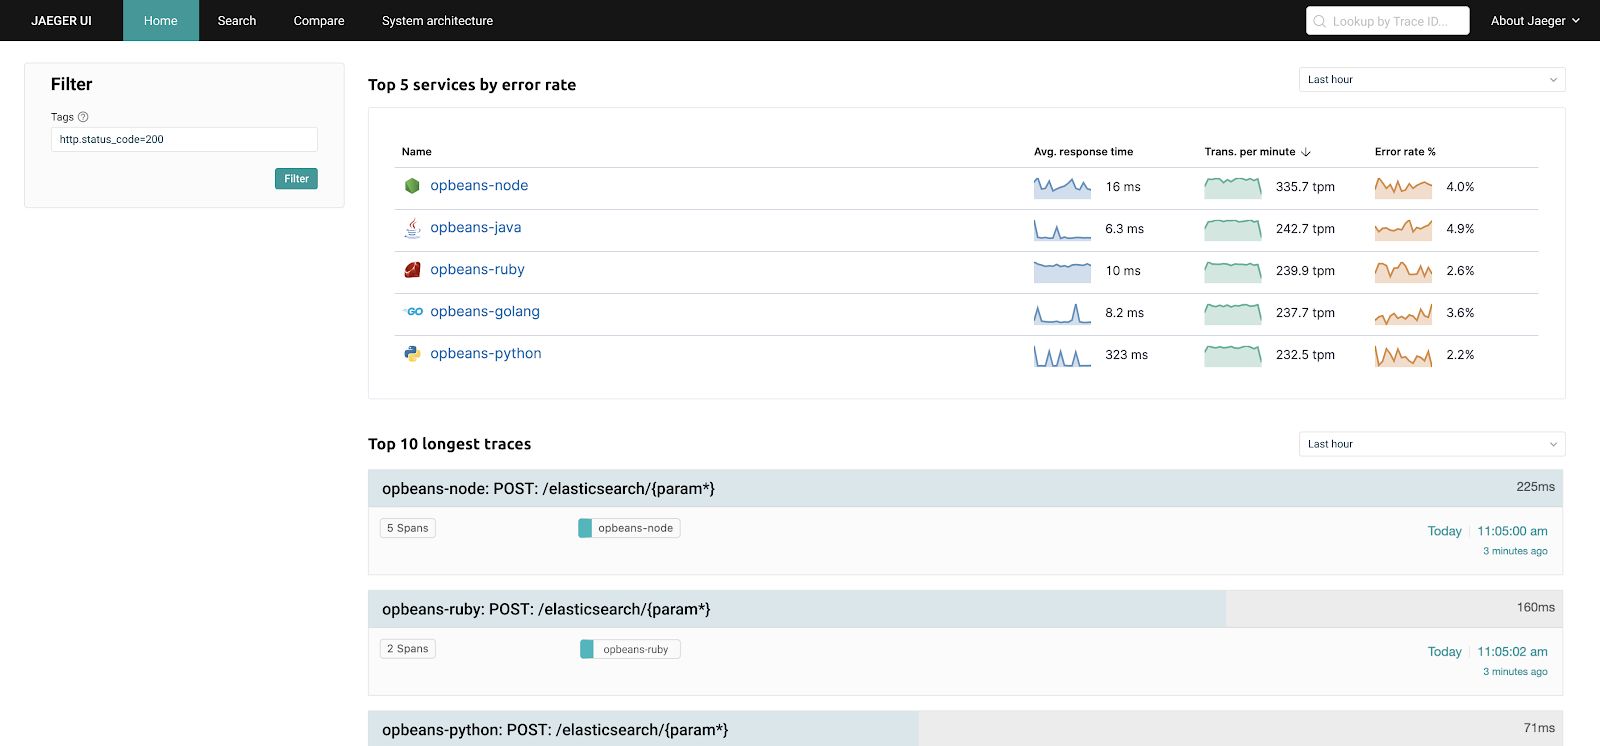
But what if we want to measure and track service level performance? What if we’d like to know which service has the most errors, which operation has the highest latency, or the highest request load? In this case, the ability to analyze metrics calculated off traces would be tremendously helpful.
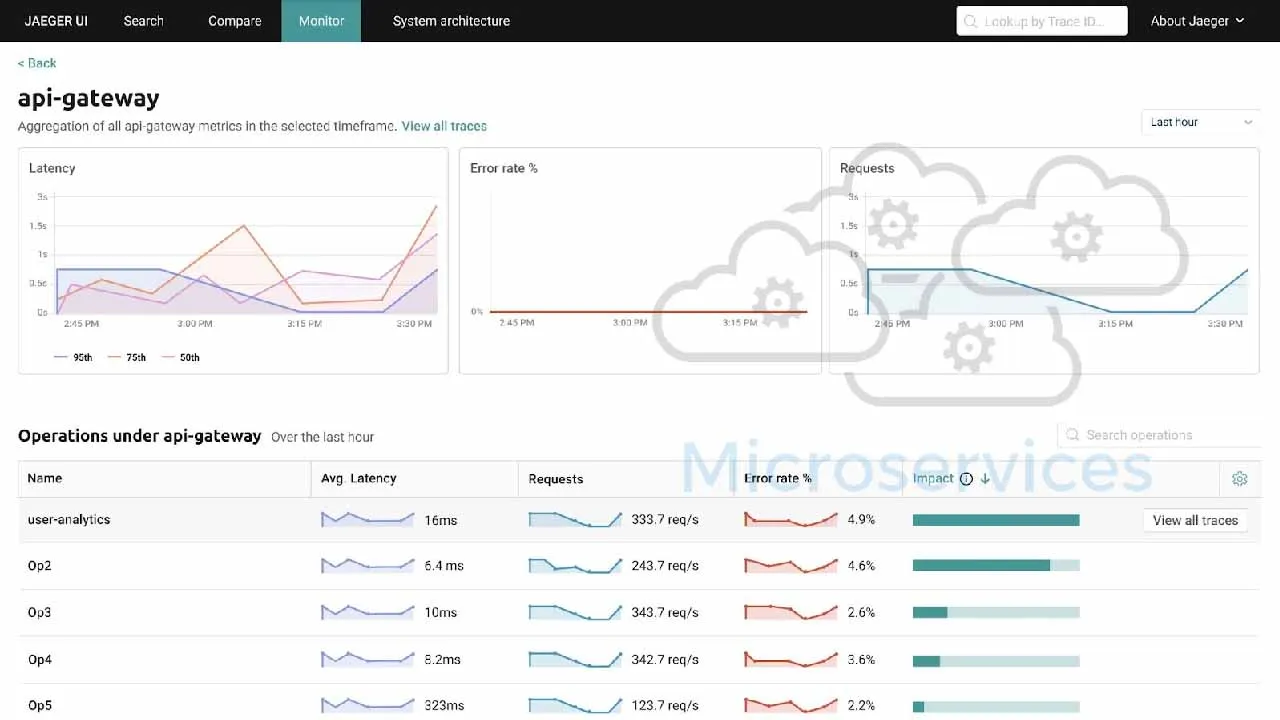
Just imagine seeing a high level performance snapshot right in your Jaeger homepage (I wish there were a Jaeger homepage at all):
When we’ve identified this need, we realized it’s time to give back to the community, by building technology that takes OpenTelemetry and Jaeger to the next level and brings Jaeger up the stack towards application performance monitoring.
#microservices #kubernetes #devops #apm #jaeger