Use SonarCube to inspect code written in 27 different programming languages
Photo by Luca Bravo on Unsplash
Automatically and continuously inspecting our code has several advantages. It will increase code reliability, maintainability and will increase overall application security. One tool to analyze our code is SonarQube.
SonarQube is a code inspection tool, which enables to perform a continuous code inspection of more than 27 different programming languages (Java, C, Go, Python, Kotlin, …).
In this article we will shortly run through the architecture and set up an environment to quickly run an analysis through our code. Finally we will explore some code examples, where SonarQube helps finding bugs and improve our code.
Understand the Architecture of SonarQube
To run code analysis with SonarQube, three components are required.
The database stores the configuration of SonarQube and the Metrics and Issues, that were found on our code. Supported are the databases PostgreSQL, Microsoft SQL Server and Oracle.
Serving the web interface is done by the Web Server. It is also responsible for analyzing the code and running searches in the database with an integrated ElasticSearch engine.
The last piece is the actual scanner, which runs through our code. This can be done manually or continuously integration with GitLab, Jenkins, etc.
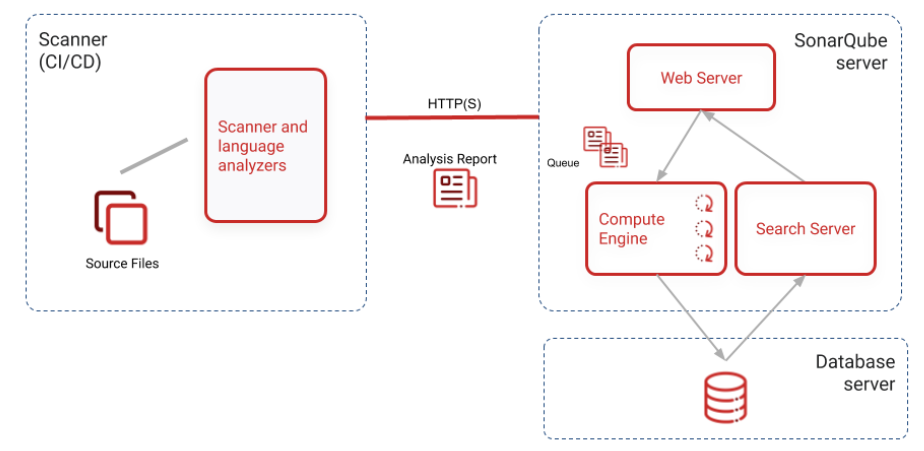
Instance Components from SonarQube
#java #software-development #application-security #sonarqube
