Not all user experiences are equal. People can have good and bad ones, even when using exactly the same website or mobile application.
Meanwhile, developers code away and release new features thinking users aren’t complaining, and everything is fine (when it’s not).
When was the last time you submitted a report for a software error? Many customers won’t take the time to create a support ticket when they experience a slow loading landing page, they’ll just close your browser and leave. Fortunately, these wasted interactions are preventable using Application Performance Monitoringtools.
Why you need application performance monitoring tools
Part of the problem is that different operating systems, browsers, connection speeds, devices and locations mean that any number of combinations could be interacting with your application.
Local testing is useful but fails to identify the vast amount of variables that users can encounter when trying to use your app.
Synthetic testing also comes up short. How do you fake millions of users interacting with your application and get an accurate view of what may happen when you deploy into production?
Nothing will beat real user interactions with your application in production for the most accurate view. Getting a window into this activity is also a lot easier than you think if you have the right tools.
Here we take a look at five Application Performance Monitoring tools that will monitor your application in production and beyond.
1. Raygun
Raygun gives your development team a unique view of how users are experiencing your software applications. Mainly, Raygun focuses on errors, crashes, and performance issues that users encounter. One of the features that saves the most time is smart error grouping, which collects errors underneath a single root cause so you don’t get flooded with notifications.
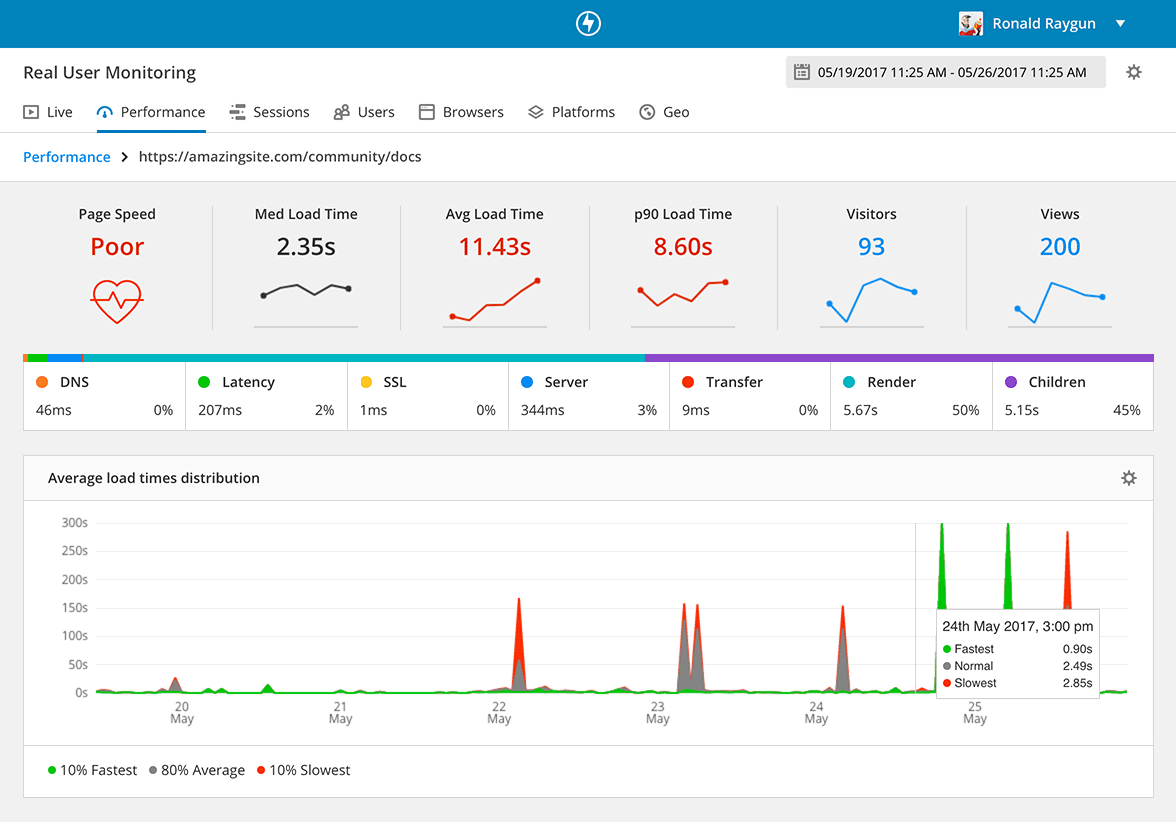
To help isolate and diagnose performance issues, page performance breakdowns are viewable for every user session to see which specific assets were the cause of a slow loading page or mobile app view. (The image below shows the Real User Monitoring tool.)
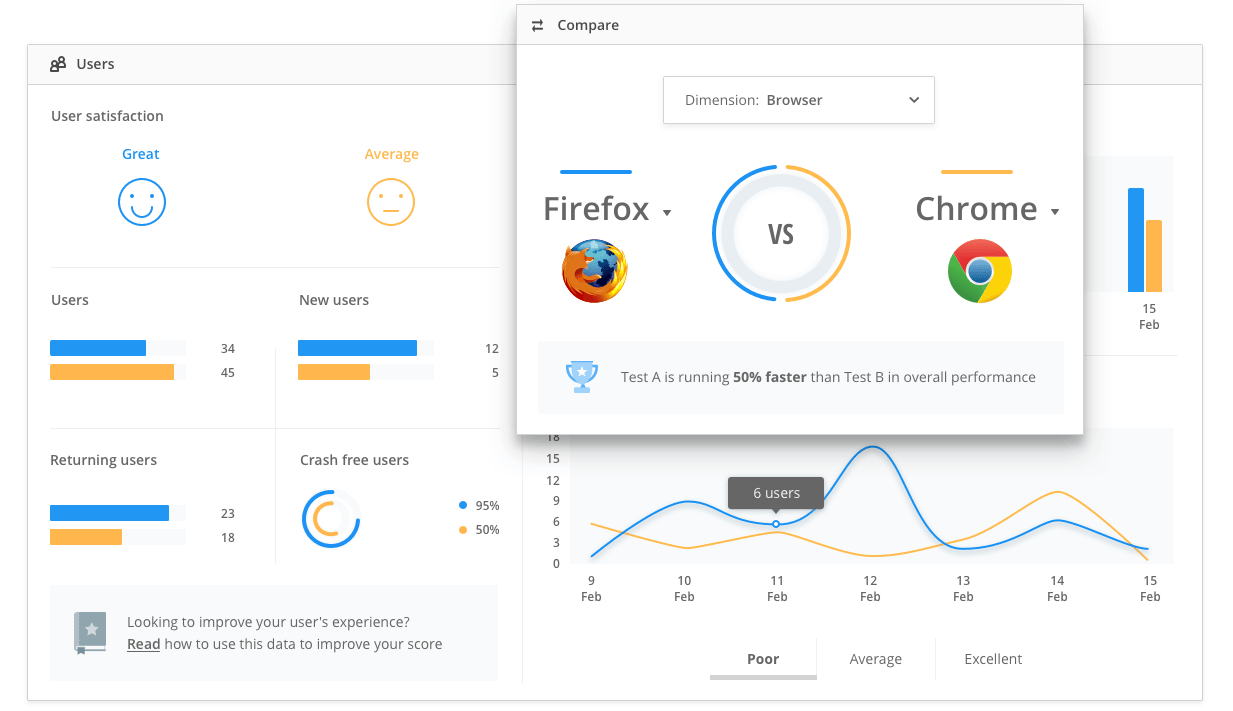
Another time-saving feature of Raygun is the ability to identify authenticated users, so you get a view of which specific users encountered problems, and to what extent. Great for surfacing VIPs or Enterprise customers who have bad user experiences. It works by enabling the developer to search a specific email address to produce a user profile. The unique profile will have a list of every error or crash that user has encountered, which browser they use, and all the devices they use to access your app.
The deployment tracking feature is also useful for surfacing problems with releases. When you release a new update or version, Raygun can identify issues that were introduced, resolved or fixed in each version.
Pretty neat for immediately spotting a poor release before they get into the hand of your customers!
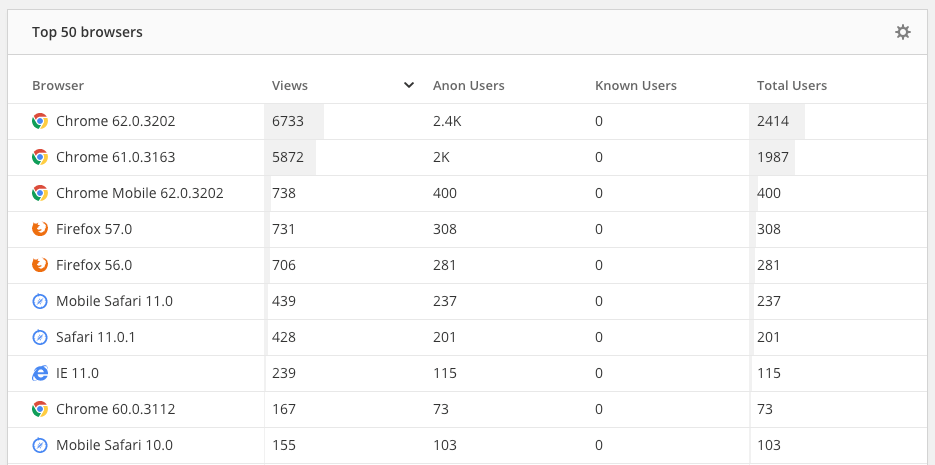
Though functionality is different to what tools like Google Analytics provides, Raygun does also incorporate some high-level analytics including which locations are experiencing the fastest and slowest loading times.
#user experiences