In last blog Chapter 4.1 we discussed in detail about some commonly used built-in PyTorch packages and some basic concepts we will be using to build out linear regression model. In this blog we will be building our model using the PyTorch built-ins.
In this blog, we’re going to use information like a person’s age, sex, BMI, no. of children and smoking habit to accurately predict insurance costs. This kind of model is useful for insurance companies to determine the yearly insurance premium for a person. The dataset for this problem is taken from: .
We will create a model with the following steps:
- Download and explore the dataset,
- Prepare the dataset for training ,
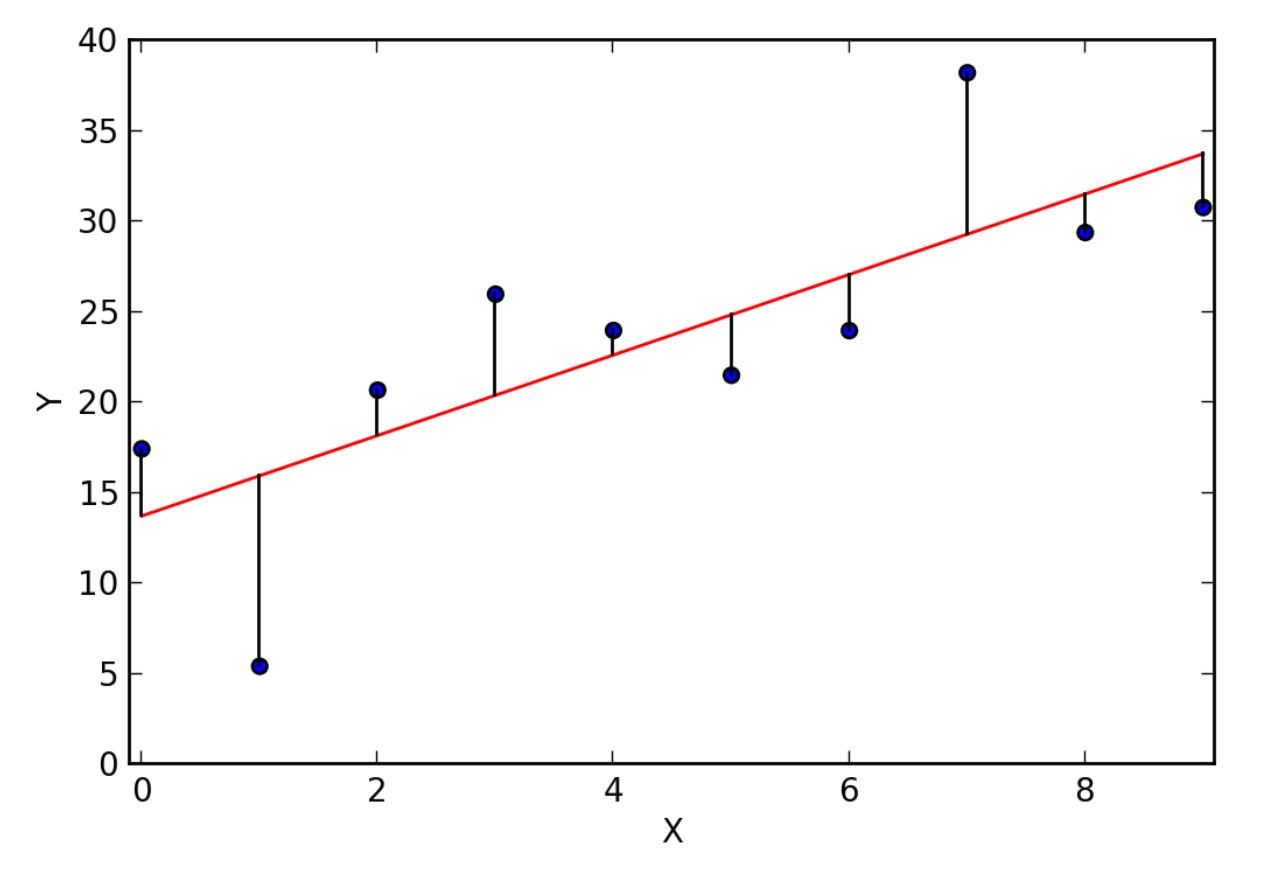
- Create a linear regression model ,
- Train the model to fit the data ,
- Make predictions using the trained model.
Generated By Author
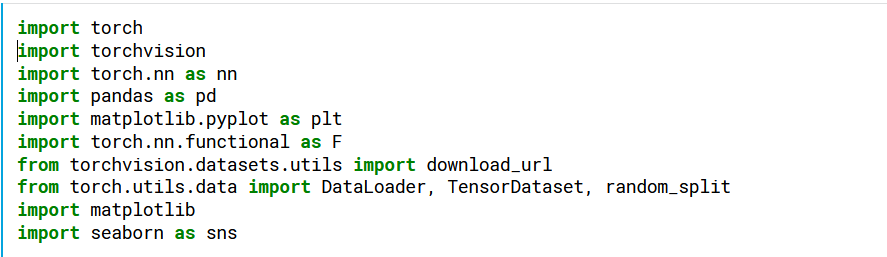
We start by importing the required packages. We have discussed about most of the packages used in the previous blog.
Step 1 :- Download and explore the data
For this blog, we will be using Kaggle platform to build our model. We could load our dataset directly from Kaggle.
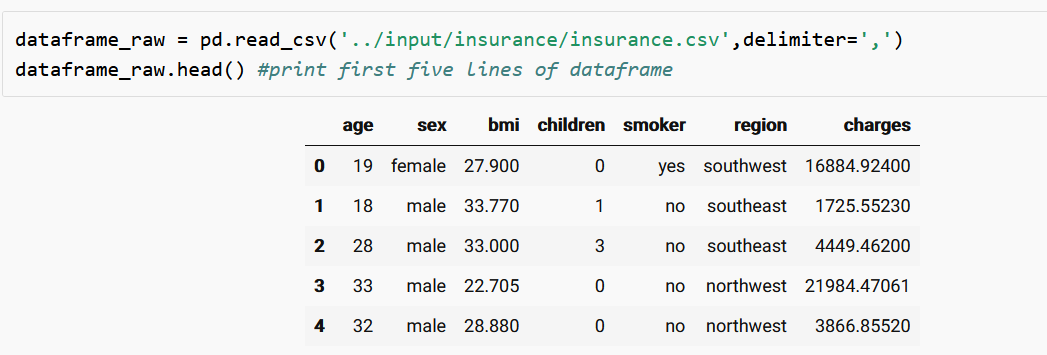
To load the dataset into memory, we’ll use the read_csv function from the pandas library. The data will be loaded as a Pandas dataframe.
Generated by Author
We could print the first five lines of the dataset using the head function in Pandas.
We are going to do a slight customization to dataset so that every reader could get a slightly different dataset. This step is not mandatory.

Generated By Author
Generated by Author
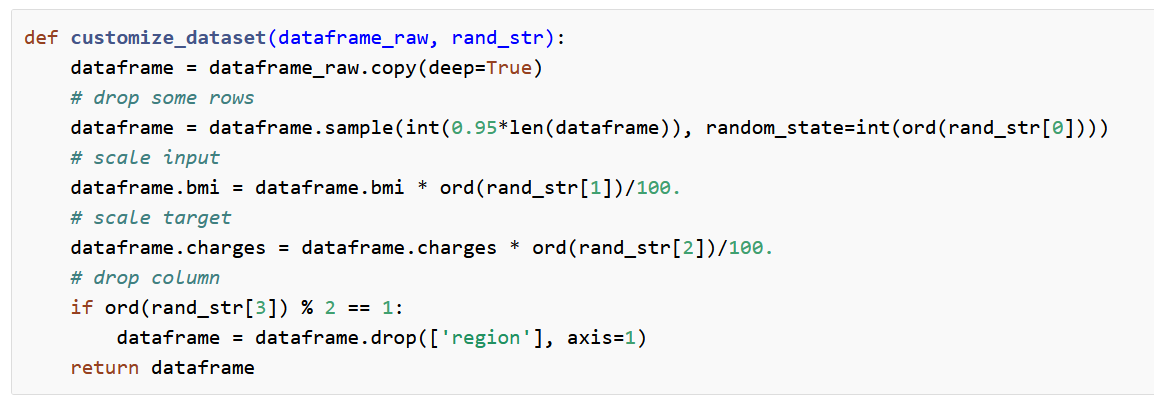
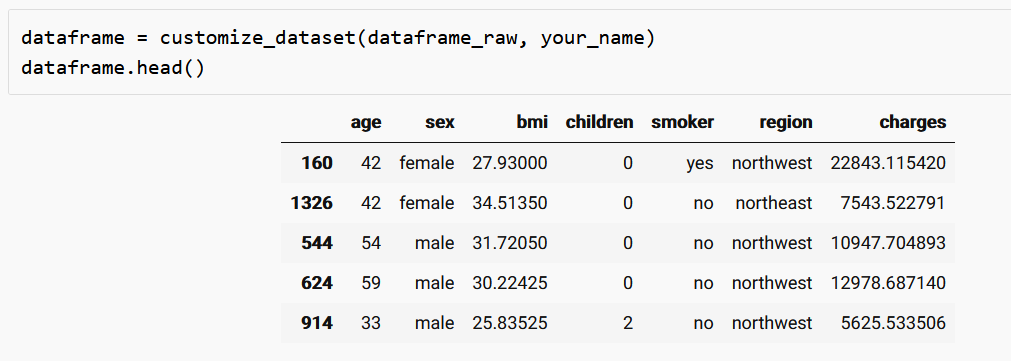
The customize_dataset function will customize the dataset slightly using your name as a source of random numbers.
Now let’s call the customize function and pass dataset and your_name as arguments and check out first few lines of our dataset using the head function.
Generated by Author
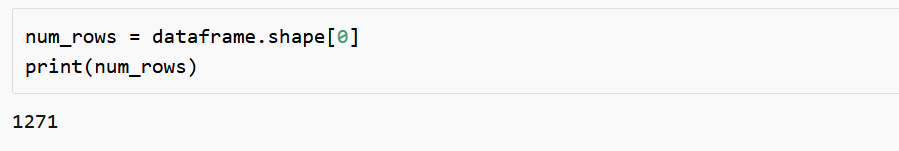
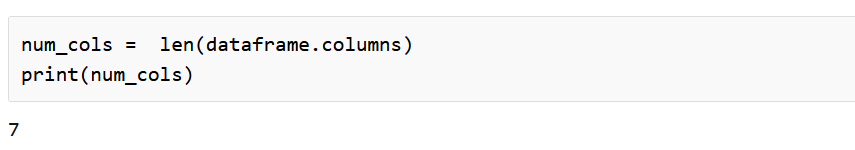
Now let’s find out the number of rows and columns in our dataset.
Generated By Author
Generated by Author
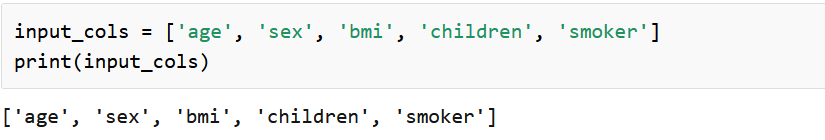
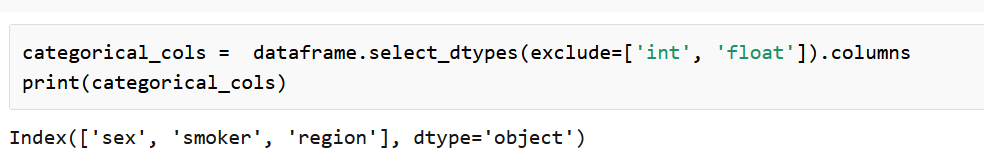
Now we should assign the input, output and categorical columns(input columns that are non-numerical).
Generated by Author
Generated by Author
Generated by Author
We can find the minimum value, maximum value and mean value of output column “charges”. We can also plot the distribution of charges in a graph. For reference do look into https://jovian.ml/aakashns/dataviz-cheatsheet.
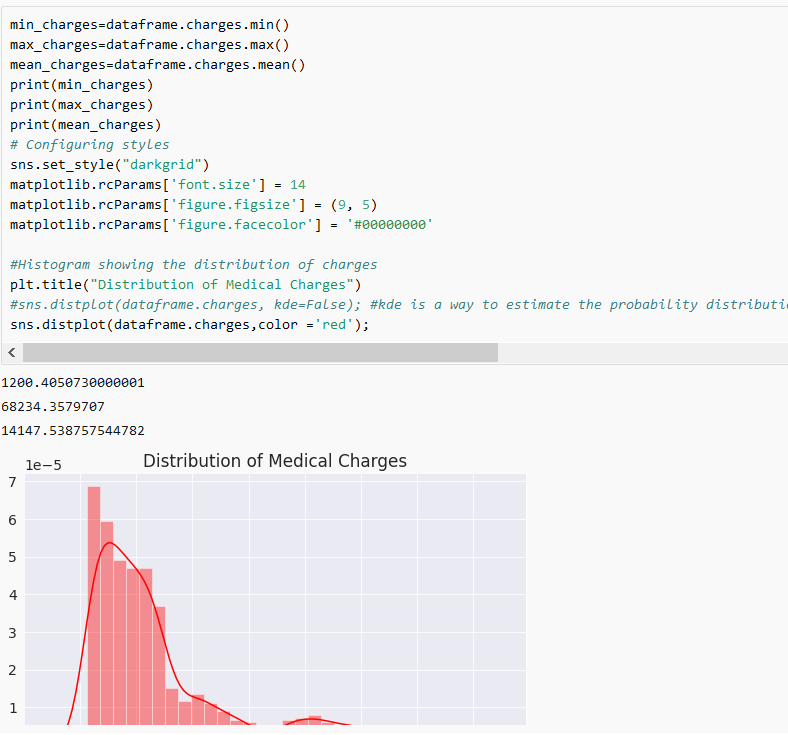
Generated by Author
#linear-regression #deep-learning #machine-learning #visualization #pytorch #deep learning
