In a previous article, “Easier D3.js — Render C3 Charts With React Functional Components,” we noted that C3 allows us to build charts quickly without knowing all of the complexity of D3. Using C3 to create a chart is just a few lines of code.
In another article, “5 Steps to Render D3.js With React Functional Components,” we mentioned that D3 provides rich features to construct graphical representations. Take charts as an example — D3 can customize every detail of axes, shapes, tool tips, texts, colors, and animation.
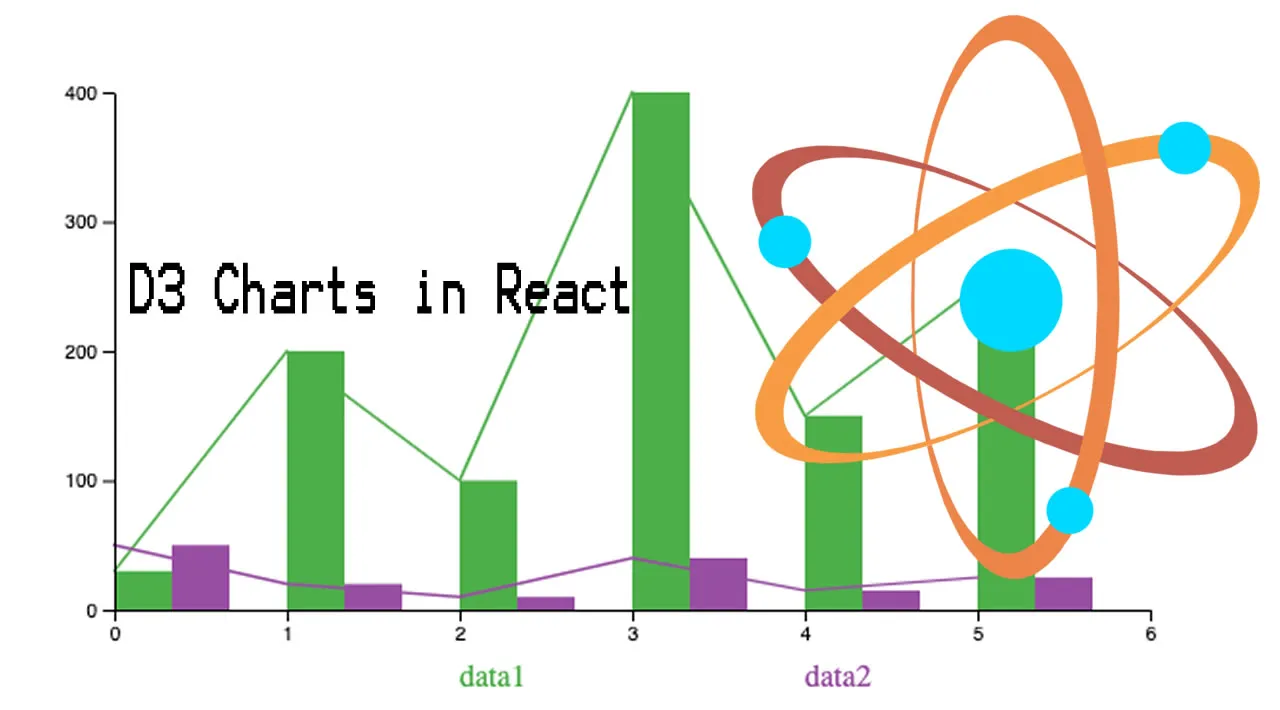
In this article, we’re going to dive into D3 line and bar charts to get firsthand experience with the complexity and capability of D3.
#javascript

1.35 GEEK