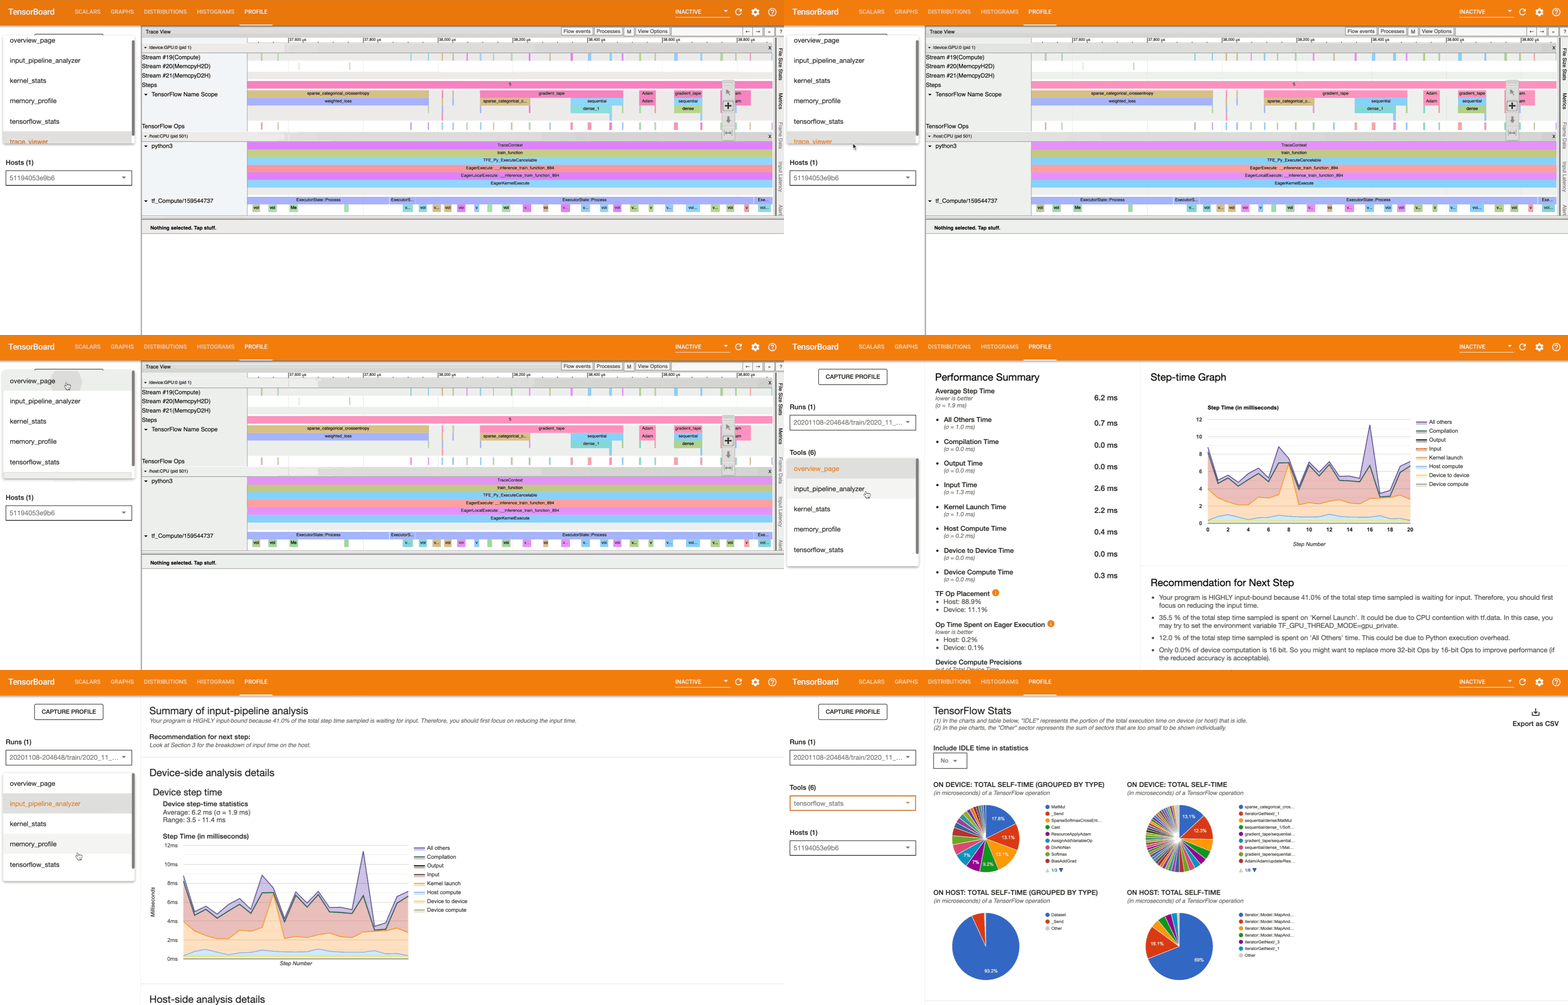
We want our models to train real fast. We use GPUs to make operations execute faster. However, it is possible that even after speeding up the computations, the model may have inefficiencies in the pipeline itself, and thus, may train slower. In such cases, it becomes really difficult to debug the code, or as a matter of fact, even tell what is slow.
This can be addressed by using the TensorFlow Profiler. The Profiler ‘profiles’ the TensorFlow code execution. We’ll be discussing the Profiler, how to use it, best practices, and how to optimize the GPU performance in this article.
Note that this article expects basic knowledge of training TensorFlow models and using Tensorboard. You can refer to my article on Tensorboard if you’re unaware of it.
TensorFlow Profiler
First things first, even before optimizing anything, let’s talk about what the profiler is and what it offers.
Profiling helps you understand the hardware resource consumption (time and memory) of the various TensorFlow operations (ops) in your model and resolve performance bottlenecks and ultimately, make the model execute faster.
Basically, the profiler monitors the model training. It notes down the time required for the ops to execute, the time required for complete steps to execute, collects insights on resource utilization in terms of time and memory and provides visualizations for understanding these insights.
In the upcoming sections, we’ll see how to work with the profiler:
- We’ll train a simple model with profiling.
- Explore the profiler to gain insights into the training.
- Use these insights to optimize training.
#data-science #deep-learning #artificial-intelligence #machine-learning #tensorflow
