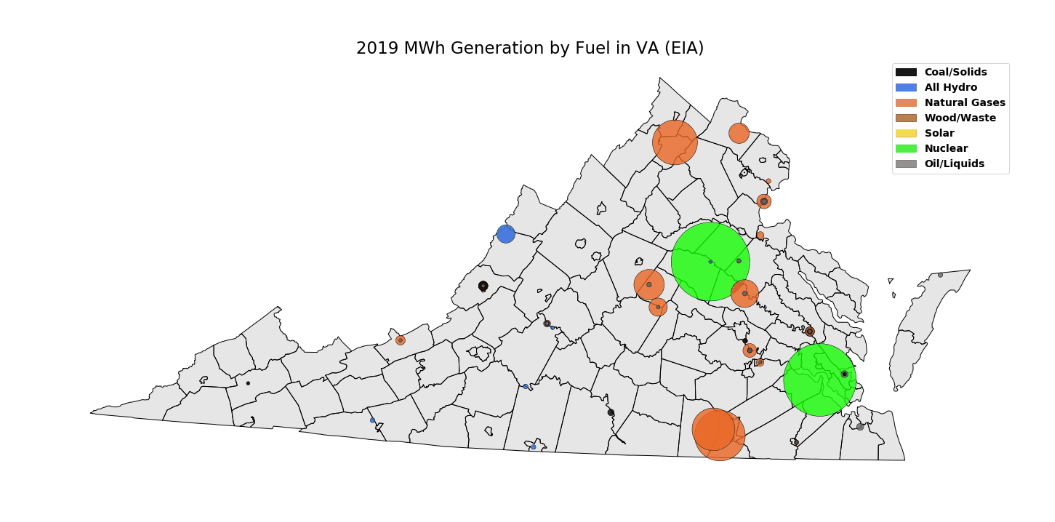
Intro
This repo contains the code and data for making a map (in gif form) of generation by Virginia power plants 2001–2019. The plotted circles are colored by fuel type and sized by the amount of generation. While the data in this repo is only for Virginia, the script I used to go through the EIA’s API and collect the data is also included, as well as a reference file from EIA form-860 and a national version of the Virginia data. Let’s run everything down.
Data Collection
I’ve already done some manual processing with the full EIA-860 form and placed that output in this repository. That form has data on individual generators, including their location. It also has proposed and canceled or retired plants. I collated those tables into one file and also added a “color” column for a different project, which I use here as well. These colors are assigned based on the “Reported Fuel Type Code” which you can find in the File Layout tab of EIA forms that contain fuel codes. However, Form-860 only has capacity, and the annual 923 forms are too tedious to grab individually for fuel and generation, so we turn to the API.
The EIA API is pretty easy to use, particularly since a few excellent humans have already written python wrappers for it. After you’ve gotten your API key, you can pip or conda install EIA_python, the package I’m using here. The “process_eia.py” file contains the code to pull generation for every year available for each plant. The list of calls is constructed from a plant+fuel combo list I made from the EIA form data. I also fold in lat and lon data from EIA-860 so that we can have one file with plants, fuels, and their coordinates, which are necessary to plot/map them.
#energy #virginia #matplotlib #geopandas #python
