If you can’t explain it to a six year old, you don’t understand it yourself.
The world still awaits the next Einstein, or perhaps it won’t ever get another person of the century. But I like to believe: in the universe and in a variation of the above quote…
The best way to learn is to teach.
The idea for this post came when I was once helping one of my juniors with an assignment on outlier detection. It wasn’t a very complicated one, just an application of IQR Method of Outlier Detection on a dataset. The tutorial took an exciting turn when he asked me:
“Why 1.5 times IQR? Why not 1 or 2 or any other number?”
Now this question won’t ring any bells for those who are not familier with IQR Method of Outlier Detection (explained below), but for those who know how simple this method is, I hope the question above would make you think about it. After all, isn’t that what good data scientists do? Question everything, believe nothing.
In the most general sense, an outlier is a data point which differs significantly from other observations. Now its meaning can be interpreted according to the statistical model under study, but for the sake of simplicity and not to divert too far from the main agenda of this post, we’d consider first order statistics and too on a very simple dataset, without any loss of generality.
IQR Method of Outlier Detection
To explain IQR Method easily, let’s start with a box plot.
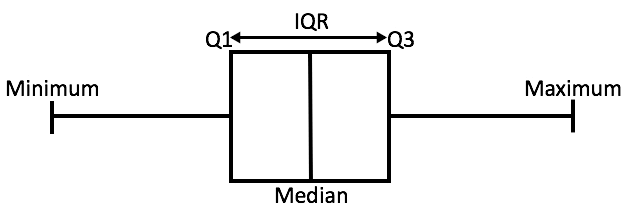
A box plot from source
A box plot tells us, more or less, about the distribution of the data. It gives a sense of how much the data is actually spread about, what’s its range, and about its skewness. As you might have noticed in the figure, that a box plot enables us to draw inference from it for an ordered data, i.e., it tells us about the various metrics of a data arranged in ascending order.
In the above figure,
- _minimum _is the minimum value in the dataset,
- and maximum is the maximum value in the dataset.
So the difference between the two tells us about the range of dataset.
- The _median _is the median (or centre point), also called second quartile, of the data (resulting from the fact that the data is ordered).
- _Q1 _is the first quartile of the data, i.e., to say 25% of the data lies between _minimum _and Q1.
- _Q3 _is the third quartile of the data, i.e., to say 75% of the data lies between _minimum _and Q3.
The difference between Q3 and Q1 is called the Inter-Quartile Range or IQR.
IQR = Q3 - Q1
To detect the outliers using this method, we define a new range, let’s call it decision range, and any data point lying outside this range is considered as outlier and is accordingly dealt with. The range is as given below:
Lower Bound: (Q1 - 1.5 * IQR)

Upper Bound: (Q3 + 1.5 * IQR)
Any data point less than the _Lower Bound or _more than the _Upper Bound _is considered as an outlier.
But the question was: Why only 1.5 times the IQR? Why not any other number?
#outlier-detection #data-science #data-preprocessing #statistics #data-preparation