Anscombe’s quartet comprises four data sets that have nearly identical simple descriptive statistics, yet have very different distributions and appear very different when graphed.
— Wikipedia
**Anscombe’s Quartet **can be defined as a group of four data sets which are nearly identical in simple descriptive statistics, but there are some peculiarities in the dataset that **fools the regression model **if built. They have very different distributions and **appear differently **when plotted on scatter plots.
It was constructed in 1973 by statistician Francis Anscombe to illustrate the **importance **of **plotting the graphs **before analyzing and model building, and the effect of other observations on statistical properties.There are these four data set plots which have nearly same statistical observations, which provides same statistical information that involves variance, and **mean **of all x,y points in all four datasets.
This tells us about the importance of visualising the data before applying various algorithms out there to build models out of them which suggests that the data features must be plotted in order to see the distribution of the samples that can help you identify the various anomalies present in the data like outliers, diversity of the data, linear separability of the data, etc. Also, the Linear Regression can be only be considered a fit for the **data with linear relationships **and is incapable of handling any other kind of datasets. These four plots can be defined as follows:
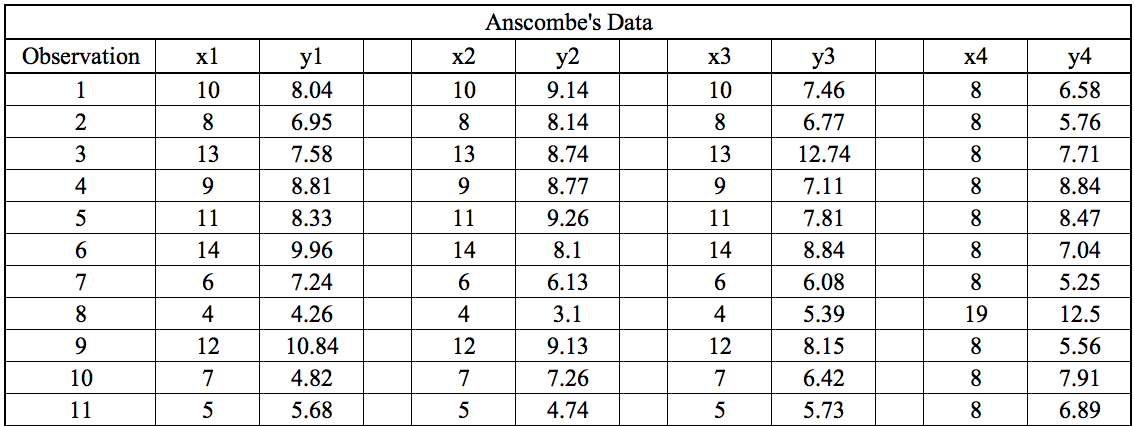
The statistical information for all these four datasets are approximately similar and can be computed as follows:

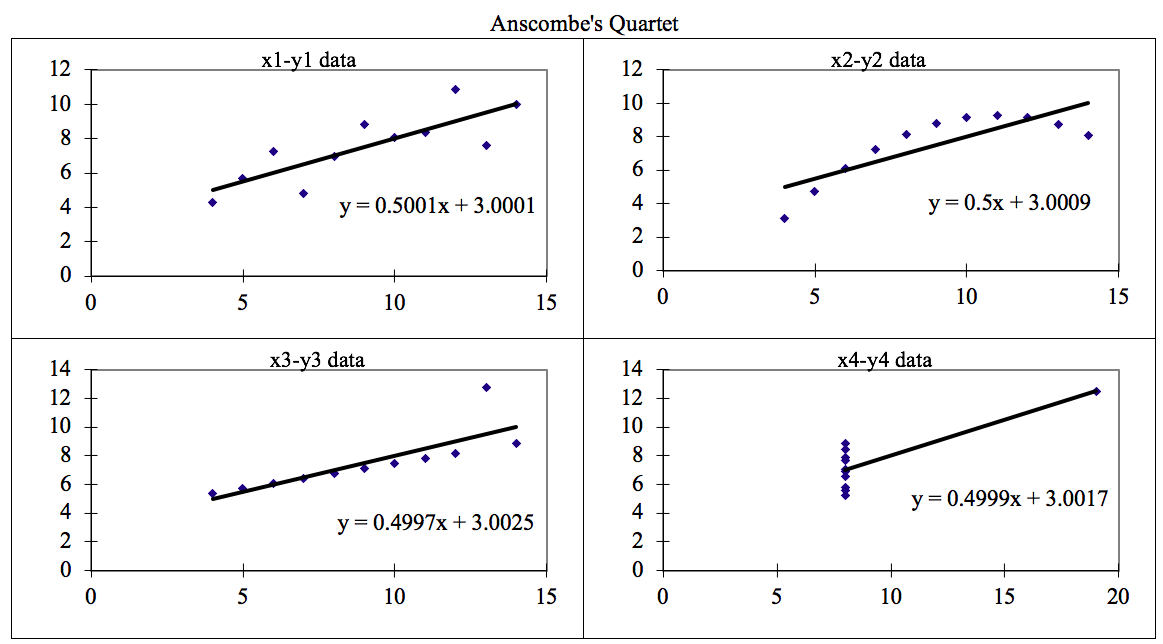
When these models are plotted on a scatter plot, all datasets generates a different kind of plot that is not interpretable by any regression algorithm which is fooled by these peculiarities and can be seen as follows:
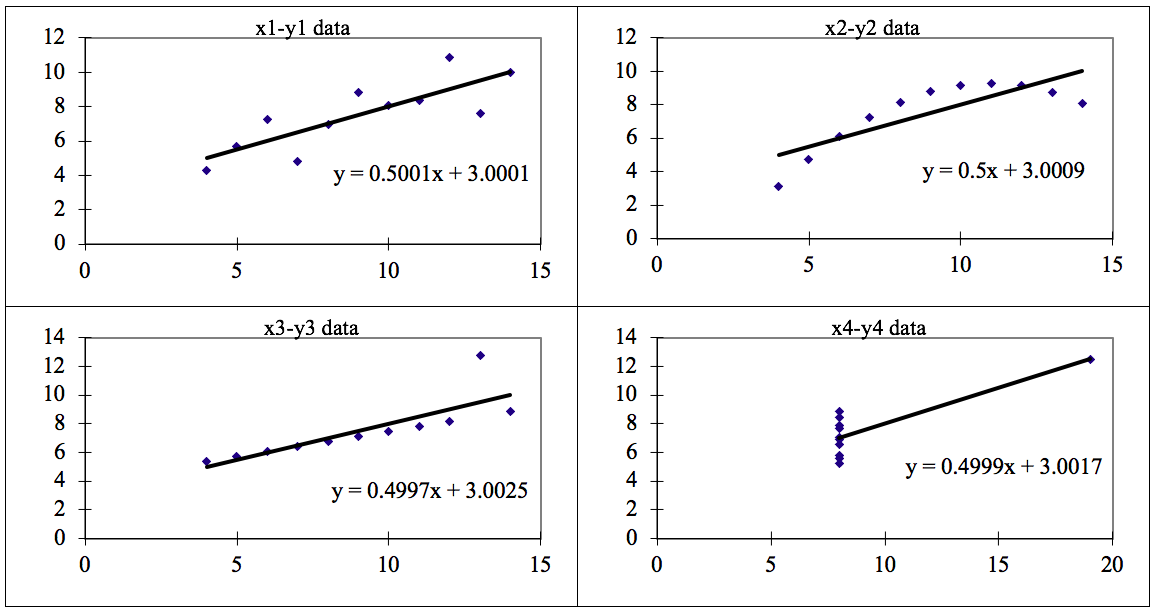
The four datasets can be described as:
- **Dataset 1: **this **fits **the linear regression model pretty well.
- Dataset 2: this **could not fit **linear regression model on the data quite well as the data is non-linear.
- **Dataset 3: **shows the **outliers **involved in the dataset which **cannot be handled **by linear regression model
- **Dataset 4: **shows the **outliers **involved in the dataset which **cannot be handled **by linear regression model
#data-science #machine-learning #data-visualization #linear-regression #exploratory-data-analysis #data analysisa