Demystifying commonly used classification metrics
Photo by Markus Winkler on Unsplash
Classification Evaluation
The metric we use to evaluate our classifier depends on the nature of the problem we want to solve and the potential consequences of prediction error. Let’s examine a very common example of cancer diagnosis (ie. classified as having cancer or not having cancer). We want our model to predict as many actual/true cancer diagnoses as possible but we also know that it is statistically impossible to correctly identify all true cancer diagnoses. Our model will eventually classify/predict someone to have cancer when they actually don’t have cancer (false positive) and predict someone not to have cancer when they actually have cancer (false negative). The question we have to ask ourselves is “What is worse? Predicting someone to have cancer when they actually don’t or predicting someone not to have cancer when they do?”. The answer in this example is obvious as the consequences of telling someone they don’t have cancer when they do far outweigh the former. Let’s keep this example in mind but let’s review the commonly used classification performance metrics.
Classification Performance Metrics
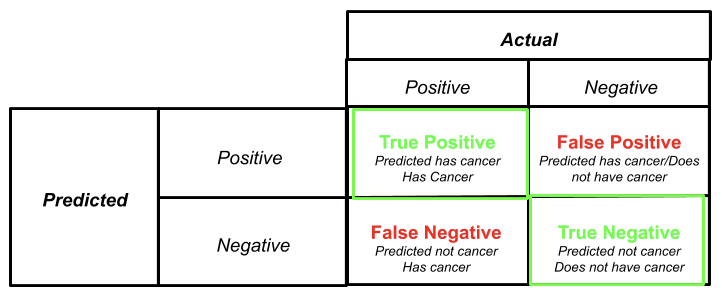
Confusion Matrix
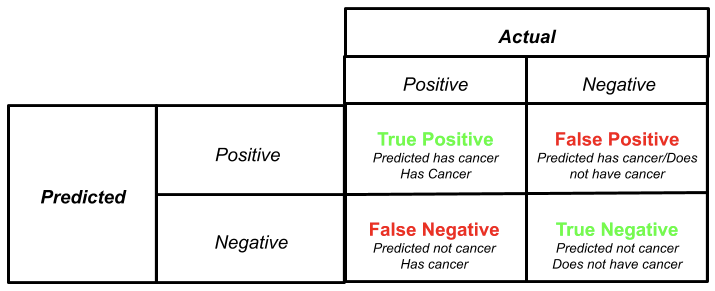
A confusion matrix summarizes are the model’s predictions. It gives us the number of correct predictions (True Positives and True Negatives) and the number of incorrect predictions (False Positives and False Negatives). In our cancer example, if our model predicted someone to have cancer and the person has cancer that’s a true positive. When our model predicted someone not to have cancer and that person does not have cancer that’s a true negative. When our model predicted someone to have cancer but that person does not have cancer that’s a false positive (ie. the model falsely predicted a positive cancer diagnosis). Finally, when our model predicted someone not to have cancer but they do that’s a false negative (ie. the model falsely predicted a negative cancer diagnosis).
Much of the remaining performance metrics are derived from the confusion matrix therefore, it is imperative you have a good understand.
Accuracy
In simplest terms, accuracy details how often our model is correct. In other words, is the number of correct predictions (TP, TF) divided by the total number of predictions. Accuracy is typically the first metric but it can be very misleading if not considered carefully. For example, let’s consider an imbalanced dataset that was used to train our model. We have 1000 non-cancer diagnoses and 10 cancer diagnoses. A model was able to correctly predict 900 of the non-cancer diagnoses and 1 of the cancer diagnoses would have an accuracy of 0.89% ((900+1)/1010=0.89).
(TP+TN)/(TP+FP+FN+TN)
#precision-recall #roc-curve #f1-score #classification-metrics #python