Getting started with Kubernetes and Prometheus
In this article, you’ll learn how can use Helm and Prometheus to continuously monitor your Kubernetes clusters
I have recently started working on a migration process to move our company deployments over to Kubernetes (from Fleet, if you were interested, which was, at the time of deployment, a pretty cutting-edge technology, but it is pretty low level, and you have to provide stuff like load balancing and DNS yourself).
A colleague of mine had already done the hard work in actually spinning up a Kubernetes cluster on AWS (using EKS) and generally most of the boilerplate around service deployment, so having had a general intro and deploying my first service (single microservice deployed as a Kubernetes “service” running inside a “pod”), which mostly just involved copy and pasting from my colleagues examples, my next goal was to deploy our monitoring setup. We currently use Prometheus and Grafana, and those still seem to be best in class monitoring systems, especially with Kubernetes.
The setup process is actually pretty simple to get up and running (at least if you are using Helm) but it did catch me out a couple times, so here are some notes.
Pre-requisites:
- A cluster running Kubernetes (as mentioned, we are using an AWS cluster on EKS)
- Kubectl & Helm running locally and connecting correctly to your kubernetes cluster (kubectl --version should display the client and server version details ok)
Let’s get started by getting our cluster ready to use Helm (Helm is a Kubernetes package manager that can be used to install pre-packaged “charts”), to do this we need to install the server side element of Helm, called Tiller, onto our Kubernetes cluster:
$ kubectl apply -f  tiller-role-binding.yml
$ helm init --service-account tiller

apiVersion: v1
kind: ServiceAccount
metadata:
  name: tiller
  namespace: kube-system

---
apiVersion: rbac.authorization.k8s.io/v1beta1
kind: ClusterRoleBinding
metadata:
  name: tiller
roleRef:
  apiGroup: rbac.authorization.k8s.io
  kind: ClusterRole
  name: cluster-admin
subjects:
  - kind: ServiceAccount
    name: tiller
    namespace: kube-system
The above does three things:
- A cluster running Kubernetes (as mentioned, we are using an AWS cluster on EKS)
- Kubectl & Helm running locally and connecting correctly to your kubernetes cluster (kubectl --version should display the client and server version details ok)
Straightforward enough. For Prometheus, we will be using a Helm packaged Prometheus Operator. A Kubernetes Operator is an approach that allows packaging of an application that can be deployed on Kubernetes and can also be managed by the Kubernetes API — you can read more about operators here, and there are lots of operators already created for a range of applications.
As I found myself repeatedly updating the config for the install, I preferred to use the Helm “upgrade” method rather than install (upgrade works even if it has never been installed):
$ helm upgrade -f prometheus-config.yml \
      prometheus-operator stable/prometheus-operator \
      --namespace monitoring --install
The above command upgrades/installs the stable/prometheus-operator package (provided by CoreOS) into the “monitoring” namespace and names the install release as “prometheus-operator."
At the start, the config was simply:
kubelet:
  serviceMonitor:
    https: true
prometheus:
  rbac:
    roleNamespaces:
      - kube-system
      - dev-apps
This config (which could have been passed as CLI arguments using “ --set ”, but was moved to a dedicated file simply because later on, we will add a bunch more config addresses. Two challenges we faced:
Adding Namespaces
We use a dedicated namespace for our actual application (in the case above, “dev-apps”), and additionally, we wanted to monitor our applications themselves as well as the core Kubernetes health, so we had to add that namespace there so Prometheus could monitor that as well.
Monitoring the Right Port
The next one was more of a head-scratcher, and used up a lot more time figuring it out. With the stable/prometheus-operator Helm install, we noticed that on the targets page of Prometheus, the monitoring/prometheus-operator-kubelet/0 and monitoring/prometheus-operator-kubelet/1 were both showing as 0/3 up.
Our targets were showing:
- monitoring/prometheus-operator-kubelet/0 (0/3 up)
- monitoring/prometheus-operator-kubelet/1 (0/3 up)
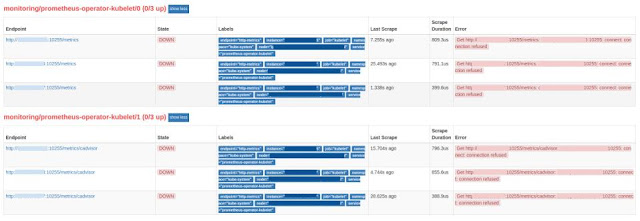
They all looked correct, much like the other targets that were reported as being up, and were hitting the endpoints http://127.0.0.1/10255/metrics and /metrics/cadvisor but were all showing errors registered as “Connect: connection refused”
Initial Googling revealed it was a fairly common symptom, however, rather misleadingly, all the issues documented were around particular flags that needed to be set and issues with auth (the errors listed were 401/403 rather than our error “connect: connection refused”) - and is also covered in the Prometheus-Operator troubleshooting section.
After much digging, what actually seemed to have caught us out was some conflicting default behavior.
The Prometheus Operator defines three different ports to monitor on:
{
  Name: "https-metrics",
  Port: 10250,
},
{
  Name: "http-metrics",
  Port: 10255,
},
{
  Name: "cadvisor",
  Port: 4194,
 }
And of the three ports defined by the source Prometheus Operator code, the Helm chart is currently set to default to “http-metrics”, e.g. to use port 10255:
{{- if .Values.kubelet.serviceMonitor.https }}
  - port: https-metrics
    scheme: https
    interval: 15s
    tlsConfig:
      caFile: /var/run/secrets/kubernetes.io/serviceaccount/ca.crt
      insecureSkipVerify: true
    bearerTokenFile: /var/run/secrets/kubernetes.io/serviceaccount/token
    honorLabels: true
  - port: https-metrics
    scheme: https
    path: /metrics/cadvisor
    interval: 30s
    honorLabels: true
    tlsConfig:
      caFile: /var/run/secrets/kubernetes.io/serviceaccount/ca.crt
      insecureSkipVerify: true
    bearerTokenFile: /var/run/secrets/kubernetes.io/serviceaccount/token
  {{- else }}
  - port: http-metrics
    interval: 30s
    honorLabels: true
  - port: http-metrics
    path: /metrics/cadvisor
    interval: 30s
    honorLabels: true
  {{- end }}
However, more recently that read-only port, 10255, has been disabled and is no longer open to monitor against. This meant we had conflicting default behavior across the software — so we had to explicitly override the default behavior on the Prometheus Operator by setting kubelet.servicemonitor.https flag to true.
kubelet:
  serviceMonitor:
    https: true
As you can see in the above defaulting, it switches between http-metrics port and https-metrics port based on the servicemonitor.https flag. Explicitly including that in our config overrode the default value and it switched to monitor on 10250 and all was fine then.
I expect the default behavior will be changed soon, so this pitfall will hopefully be short-lived, but in case it helps anyone else, I will leave it here.
Next up, I will attempt to explain some of the magic behind the Prometheus configuration and how it can be setup to easily monitor all (or any) of your Kubernetes services.
#kubernetes