Line chart using chart js in angular 12 example; In this tutorial, i am going to show you how install chart js and create line chart in angular 12 app.
Chart.Js is a well-recognized JavaScript library, and It is used to represent the data using the HTML5 canvas. It allows us to build dynamic as well as static charts, and it comes with full animation support for the various charts. It takes data in the JSON form, so it is merely simple to use it with any programming language.
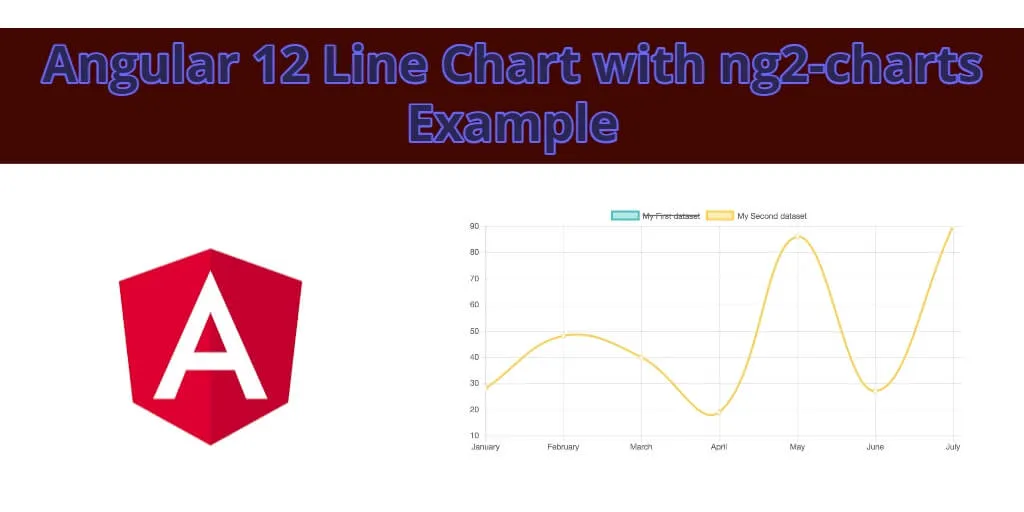
Line Chart Example in Angular 12
- Step 1 – Create New Angular App
- Step 2 – Install Charts JS Library
- Step 3 – Import Modules on App.Module.ts File
- Step 4 – Add Code on View File
- Step 5 – Add Code On line-chart.Component ts File
- Step 6 – Start the Angular Line Chart App
https://laratutorials.com/angular-12-line-chart-using-js-chart/
24.20 GEEK