Statistics is a form of mathematical analysis that uses quantified models and representations for a given set of experimental data or real-life studies. The main advantage of statistics is that information is presented in an easy way. Recently, I reviewed all the statistics materials and organized the 8 basic statistics concepts for becoming a data scientist!
- Understand the Type of Analytics
- Probability
- Central Tendency
- Variability
- Relationship Between Variables
- Probability Distribution
- Hypothesis Testing and Statistical Significance
- Regression
Understand the Type of Analytics
Descriptive Analytics tells us what happened in the past and helps a business understand how it is performing by providing context to help stakeholders interpret information.
**Diagnostic Analytics **takes descriptive data a step further and helps you understand why something happened in the past.
Predictive Analytics predicts what is most likely to happen in the future and provides companies with actionable insights based on the information.
Prescriptive Analytics provides recommendations regarding actions that will take advantage of the predictions and guide the possible actions toward a solution.
Probability
Probability is the measure of the likelihood that an event will occur in a Random Experiment.
Complement: P(A) + P(A’) = 1
Intersection: P(A∩B) = P(A)P(B)
Union: P(A∪B) = P(A) + P(B) − P(A∩B)
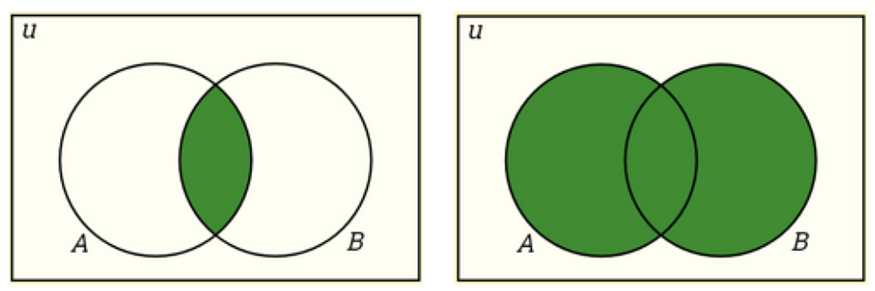
Intersection and Union.
Conditional Probability: P(A|B) is a measure of the probability of one event occurring with some relationship to one or more other events. P(A|B)=P(A∩B)/P(B), when P(B)>0.
Independent Events: Two events are independent if the occurrence of one does not affect the probability of occurrence of the other. P(A∩B)=P(A)P(B) where P(A) != 0 and P(B) != 0 , P(A|B)=P(A), P(B|A)=P(B)
Mutually Exclusive Events: Two events are mutually exclusive if they cannot both occur at the same time. P(A∩B)=0 and P(A∪B)=P(A)+P(B).
**Bayes’ Theorem **describes the probability of an event based on prior knowledge of conditions that might be related to the event.
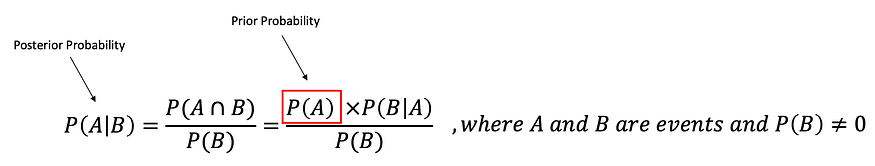
Bayes’ Theorem.
Central Tendency
Mean: The average of the dataset.
Median: The middle value of an ordered dataset.
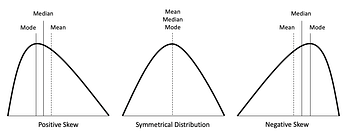
Mode: The most frequent value in the dataset. If the data have multiple values that occurred the most frequently, we have a multimodal distribution.
Skewness: A measure of symmetry.
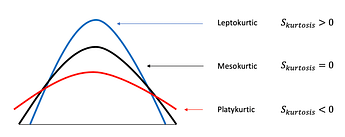
Kurtosis: A measure of whether the data are heavy-tailed or light-tailed relative to a normal distribution
Variability
Range: The difference between the highest and lowest value in the dataset.
Percentiles, Quartiles and Interquartile Range (IQR)
- **Percentiles **— A measure that indicates the value below which a given percentage of observations in a group of observations falls.
- Quantiles— Values that divide the number of data points into four more or less equal parts, or quarters.
- Interquartile Range (IQR)— A measure of statistical dispersion and variability based on dividing a data set into quartiles. IQR = Q3 − Q1
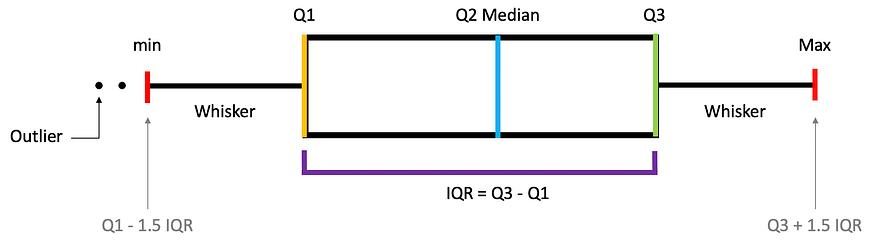
Percentiles, Quartiles and Interquartile Range (IQR).
Variance: The average squared difference of the values from the mean to measure how spread out a set of data is relative to mean.
Standard Deviation: The standard difference between each data point and the mean and the square root of variance.
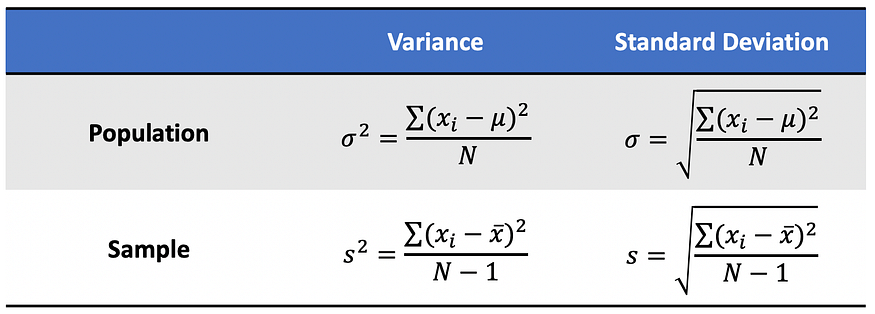
Population and Sample Variance and Standard Deviation.
**Standard Error **(SE): An estimate of the standard deviation of the sampling distribution.
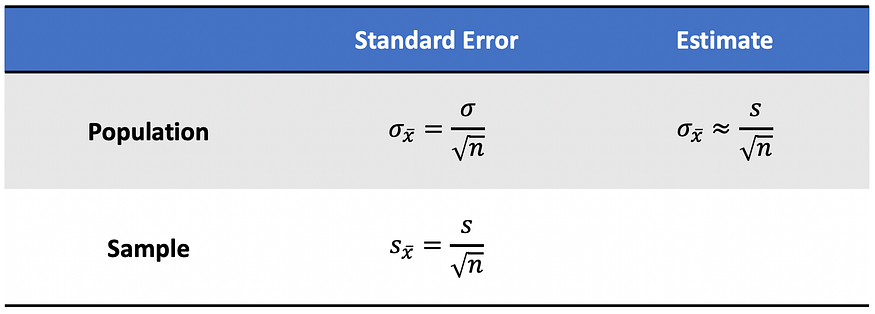
Population and Sample Standard Error.
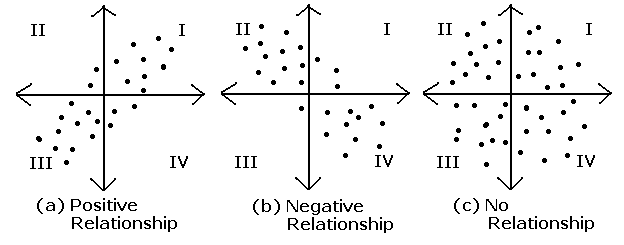
Relationship Between Variables
Causality: Relationship between two events where one event is affected by the other.
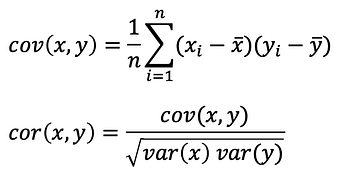
Covariance: A quantitative measure of the joint variability between two or more variables.
Correlation: Measure the relationship between two variables and ranges from -1 to 1, the normalized version of covariance.
#2020 jun tutorials # overviews #beginners #causation #correlation #linear regression #probability #statistics