Hypothesis testing is a procedure where researchers make a precise statement based on their findings or data. Then, they collect evidence to falsify that precise statement or claim. This precise statement or claim is called the null hypothesis. If the evidence is strong to falsify the null hypothesis, we can reject the null hypothesis and adapt the alternative hypothesis. This is the basic idea of hypothesis testing.
Error Types in Statistical Testing
There are two distinct types of errors that can occur in formal hypothesis testing. They are:
Type I: Type I error occurs when the null hypothesis is true but the hypothesis testing results show the evidence to reject it. This is called a false positive.
Type II: Type II error occurs when the null hypothesis is not true but it is not rejected in hypothesis testing.
Most hypothesis testing procedure performs well controlling type I error (at 5%) in ideal conditions. That may give a false idea that there is only a 5% probability that the reported findings are wrong. But it’s not that simple. The probability can be much higher than 5%.
Normality of the Data
The normality of the data is an issue that can break down a statistical test. If the dataset is small, the normality of the data is very important for some statistical processes such as confidence interval or p-test. But if the data is large enough, normality does not have a significant impact.
Correlation
If the variables in the dataset are correlated with each other, that may result in poor statistical inference. Look at this picture below:
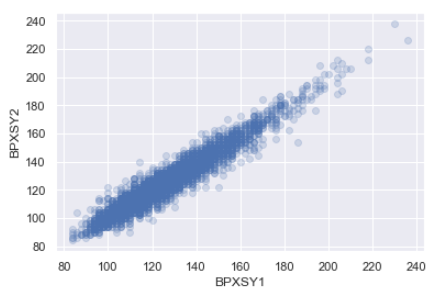
In this graph, two variables seem to have a strong correlation. Or, if a series of data is observed as a sequence, that means values are correlated with its neighbors, and there may have some clustering or autocorrelation in the data. This kind of behavior in the dataset can adversely impact the statistical tests.
Correlation and Causation
This is especially important when interpreting the result of a statistical test. “Correlation does not mean causation”. Here is an example. Suppose, you have study data that shows, more people who do not have college education believe that women should get paid less than men in the workplace. You may have conducted a good hypothesis testing and prove that. But care must be taken on what conclusion is drawn from this. Probably, there is a correlation between college education and the belief that ‘women should get paid less’. But it is not fair to say that not having a college degree is the cause of such belief. This is a correlation but not a direct cause ad effect relationship.
A more clear example can be provided from medical data. Studies showed that people with fewer cavities are less likely to get heart disease. You may have enough data to statistically prove that but you actually cannot say that the dental cavity causes heart disease. There is no medical theory like that.
#statistical-analysis #statistics #statistical-inference #math #data analysis