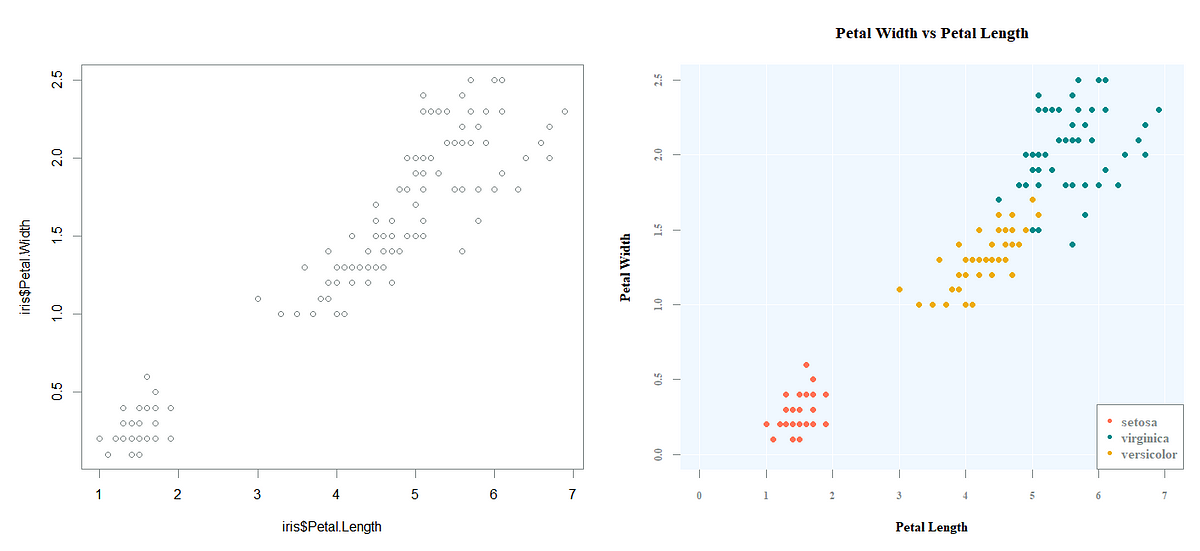
Using the base plotting system in R can seem overwhelming, but it doesn’t have to be.
Base plotting in R can be intimidating. It takes a canvas approach to plot construction, allowing you to paint layer after layer of detail onto your graphics. As a result, there is a seemingly endless number of functions and attributes to learn, but there’s no need to panic or jump straight to ggplot. This article highlights the versatility of the base plot() function while giving you some quick tricks to create beautiful plots.
#data-visualization #data-science #r #learning-to-code #plotting

1.15 GEEK