If you’re working with infrastructure, you’re undoubtedly leveraging infrastructure as code, right? I sure hope so. Otherwise, start now. I’ll be waiting.
A natural evolution might be creating a graphical representation of your infrastructure. Diagrams as code if you will. It is not a new idea. This technique appeared in the tech radar back in 2015. You can hark back to that period where people thought that generating code from UML diagrams was a sensible idea.
Let’s forget that ever happened! Instead, let’s think about using visualization to understand complex architectures. And maintaining those artifacts up to date while we’re at it. I’m going to talk about a tool that builds on top of Graphviz called Diagrams.
What is diagrams?
A tool with a very generic name, that’s for sure. If you check its website, it’s described as:
Diagrams lets you draw the cloud system architecture in Python code.
Pretty straight-forward. Installing it is a one-liner.
pip3 install diagrams
We’re going to create infrastructure diagrams with Python. We’ll commit both the image and the code used to generate them so that everybody in the team can make changes. Let’s get coding, err drawing. I have two examples for you.
Alerting workflow
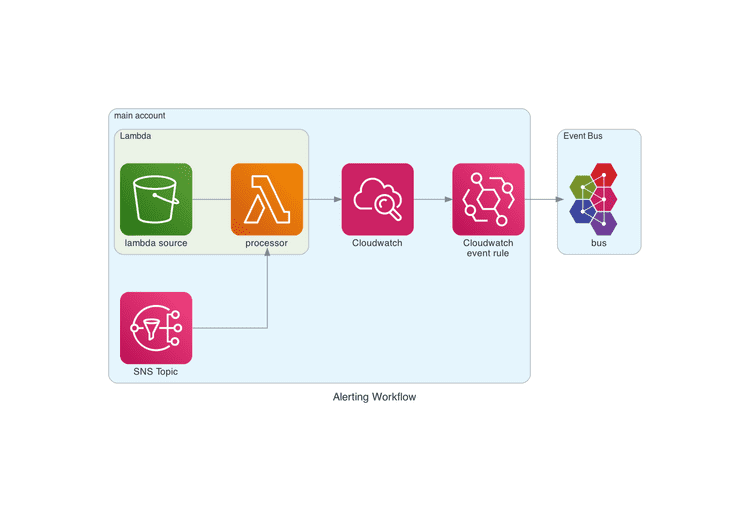
Let’s say you have a workflow where you publish alarms to an SNS Topic. That topic is processed by a lambda function, which transforms the data and writes it back to Cloudwatch. Through an event rule, the right alerts reach our event bus.
So much text for such a little thing. I’m surprised you’re still paying attention. Let me hit you with a fancy diagram.

If you check the code, you’ll notice how simple it is. There are three elements.
- The nodes, which are single components. It has a recognizable icon and a name.
- The edges, which are the connections between components. They can be directed or undirected.
- The clusters, which group nodes logically.
And there is not much else. The diagram is built with this snippet.
Notice how quickly you can get a decent overview of your system with a just bit of Python.
#infrastructure-as-code #documentation #diagrams
