Key methods to understanding and utilizing pandas
I figure since you have found yourself navigating to this page that you probably have a good amount of data that you are looking to analyze, and you may possibly be wondering the best and most efficient way to answer some of your questions about your data. The answer to your questions can be found with the use of the Pandas package.
How to access Pandas
Due to the popularity of Pandas it has its own conventional abbreviation, so anytime you are importing pandas into python, use the nomenclature below:
import pandas as pd
Primary Use of Pandas package is the DataFrame
The pandas API defines a pandas dataframe as:
Two-dimensional, size-mutable, potentially heterogeneous tabular data. Data structure also contains labeled axes (rows and columns). Arithmetic operations align on both row and column labels. Can be thought of as a dict-like container for Series objects. The primary pandas data structure.
Basically, all that means is that you have data contained in the format to what you see below. Data found in rows and columns:
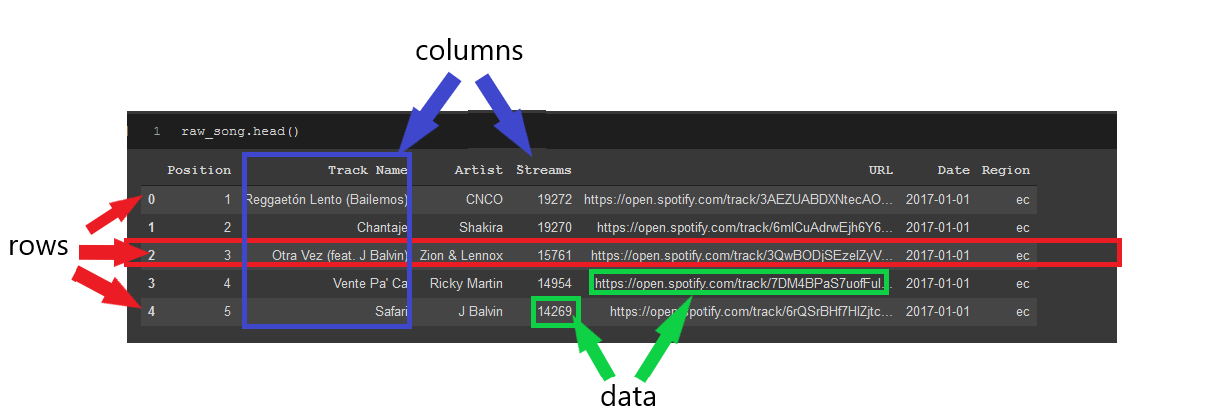
Example dataframe with labels for data, rows and columns. Dataset from https://www.kaggle.com/yamaerenay/spotify-dataset-19212020-160k-tracks
DataFrames are extremely useful because they provide an efficient way to visualize data and then manipulate it the way you want it to be. The rows can be easily referenced by the index which are the numbers on the far left of the dataframe. The index will be the corresponding row’s number starting at zero, unless you specify names to each row. The columns can also be easily referenced by the column name such as “Track Name” or by their position in the dataframe. We will talk in more detail about referencing rows and columns later in this article.
Creation Time!
There are several ways to create a pandas dataframe:
- Import data from a .csv file (or other file type e.g. Excel, SQL database)
- from a list
- from a dictionary
- from a numpy array
- many, many more!
In general, you will mainly be putting data from a .csv file, or some type of data source into a pandas dataframe and not making it from scratch since that would take an insanely long time to do depending on the amount of data you have. Here is a quick, simple example from a python dictionary:
import pandas as pd
dict1 = {'Exercises': ['Running','Walking','Cycling'],
         'Mileage': [250, 1000, 550]}
df = pd.DataFrame(dict1)
df
Output:
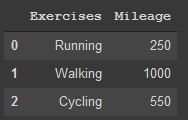
Basic dataframe made from code above
The dictionary keys (‘Exercises’ and ‘Mileage’) become the corresponding column headers. The values in the dictionary being the lists in this example became the individual data points in the dataframe. The order that the lists are in matters since Running will be placed in first since it is first in the ‘Exercises’ list and 250 will be placed in first in the second column since it is first in the ‘Mileage’ list. Also, you will notice that since I did not specify labels for the index of the dataframe it automatically was labelled 0,1, and 2.
However, like I said before the most likely way that you will be creating a pandas dataframe is from a csv or other type of file that you will import in to analyze the data. This is easily completed with just the following:
df = pd.read_csv("file_location.../file_name.csv")
pd.read_csv() is an extremely strong and versatile method and will be extremely useful depending on how you are looking to import your data. If your csv file already comes with headers or an index, you can specify this while importing and make you life so much easier. In order to understand the full ability of pd.read_csv() I suggest you look at the pandas API here.
First things first
Now you have this huge dataset ready to analyze, you have got to take a look at it and see what it looks like. As a person who is analyzing this data, you first have to become comfortable with the dataset, and really get to know what is going on in the dataset. There are four methods that I love to use in order to get to know my data and which pandas makes super easy.
- .head() & .tail()
- .info()
- .describe()
- .sample()
raw_song.head()
The line above is the line that I have in the picture at the top of the page. It with display the first 5 lines of the dataframe and each of the columns to give you an easy summary of what the data looks like. You can also specify a certain number of rows inside the () of the method to show more rows if your heart so desires.
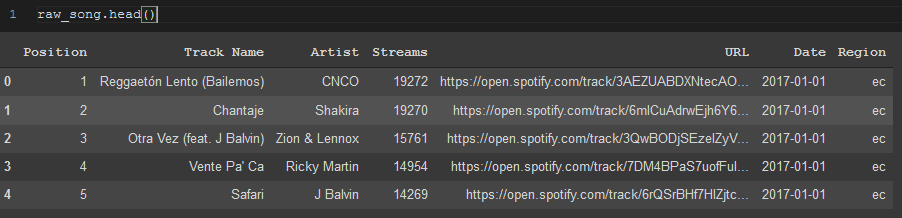
.head() method on song data from Spotify dataset
.tail() is the same just displaying the last 5 lines.
raw_song.tail()

.tail() method on song data from Spotify dataset
From these two quick methods, I have a general idea or the column names and just what the data looks like just from a small sample of the dataset. These methods are also really useful especially given a dataset such as the Spotify dataset working with over 3 million rows, you can easily display the dataset and get a quick idea, and it won’t take your computer a long time to display the data.
.info() is also useful in that it shows me a succinct list of all of the columns, their datatypes, and whether you have any null datapoints or not.
raw_song.info(verbose=True, null_counts=True)
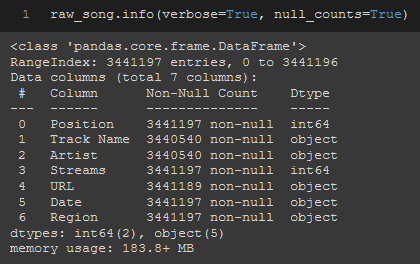
.info() method on song data from Spotify dataset
If you have completely integer or float columns (i.e. ‘Position’, ‘Streams’), then .describe() can be a useful method to understand more about your dataset as it will show many descriptive statistics about those columns.
raw_song.describe()
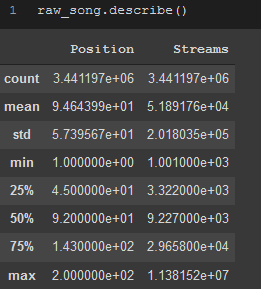
.describe() method on song data from Spotify dataset. Notice that only ‘Position’ and ‘Streams’ columns are shown since they were the only two integer columns, the other columns are strings and do not have descriptive stats.
Lastly, .sample() will allow you to randomly sample your dataframe and see if any manipulation that you made has incorrectly changed something in your dataset, and can also be great when first exploring your dataset just to get an idea of what the dataset contains exactly that was not already shown in the previous methods.
raw_song.sample(10)
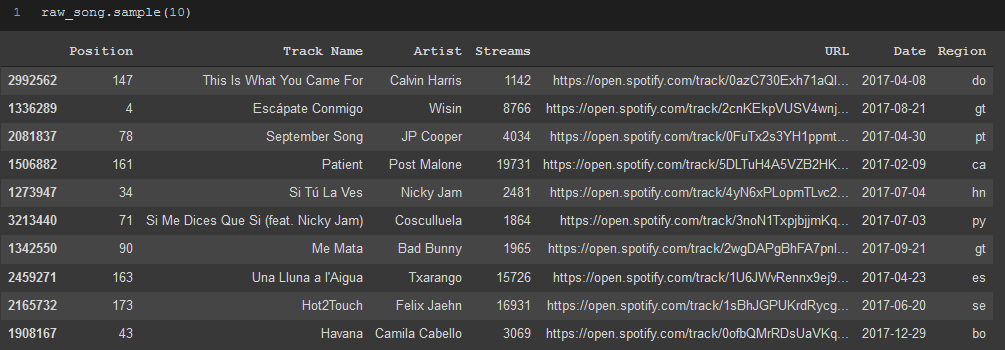
.sample() method on song data from Spotify dataset.
I use each of these methods consistently while exploring and preparing my datasets for analysis. Anytime I change the data in a column, change a column name, or add/delete a row/column I will then make sure it all changed the way I wanted it to by quickly running at least some of the previous 5 methods.
#pandas #python #data-science #data-analytics #developer