Note from Towards Data Science’s editors:_ While we allow independent authors to publish articles in accordance with our rules and guidelines, we do not endorse each author’s contribution. You should not rely on an author’s works without seeking professional advice. See our Reader Terms for details._
Financial research is an endless exciting field with many “**Eureka” **and “**Oh no!” **moments. We always seek out that golden strategy that works all the time and makes us sleep well during the night, but we are often encountered with “Oh no!” moments. This is quite normal, we are looking for a needle in a haystack, the needle being a decent strategy and the haystack being the endless possibilities of ideas.
Sometimes, simplicity is the key for success. We do not need dozens of technical indicators giving out signals here and there only to find ourselves net losers at the end of the month. We have to understand two things about technical indicators:
- They are price derived. this means that they take the price and decompose it to understand some characteristics. They are therefore not forward looking but backward looking. Our hope is for this backward relationship to continue in the future. For example, if we see a divergence on the RSI, we are hoping it causes exhaustion in prices like it usually does. This divergence does not peek at the future, it is simply a mathematical observation.
- They are unlikely to provide a winning strategy on their own. If they did, then why aren’t we all millionaires depending on overbought/oversold zones on the Stochastic indicator? Trading is much more complicated than that and requires a more thorough approach to find profitable trades.
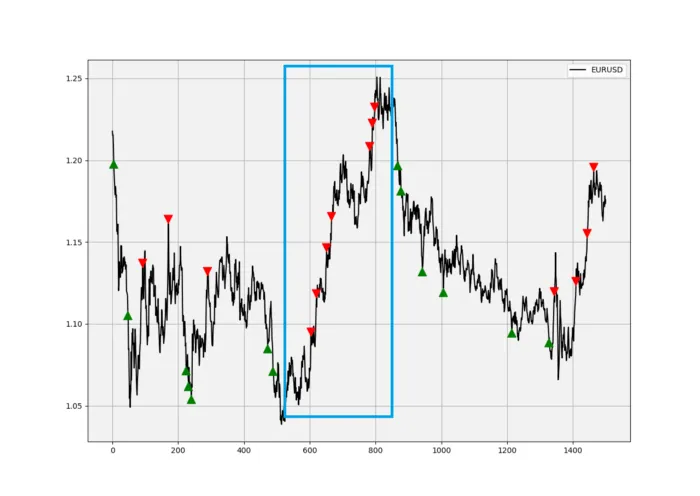
With that being in mind, we should think of indicators as little helpers with our convictions. For example, when we find sufficient information to tell us to go long (buy) an asset, we can check the technical indicators to see whether they confirm this or not. We should also check the current market state to know whether the indicator is going to provide a good signal or not. This means that we should not use mean-reverting indicators when we are in a trending market. The below graph shows why. It is the sell signals given by the RSI on an upward trending market. Notice the trending price action inside the blue rectangle, it is clear that the quality of the signals is quite bad.
#investing #finance #business #data-science #trading