Introduction
As you may know, raw financial data is made of ticks, which represent market transactions. Every market transaction is characterized, among other things, by a date, a time, a price and the number of contracts or shares that have been exchanged.
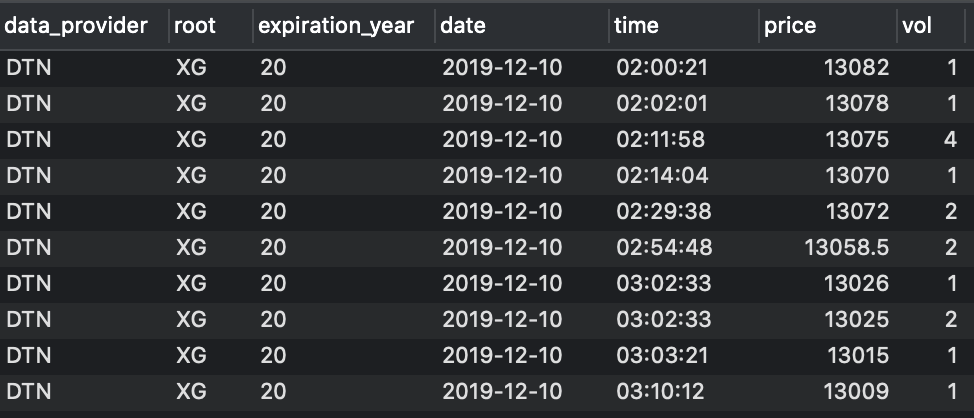
An example of raw tick data taken from a securities database
To represent financial time series you normally use bars, which are aggregations of ticks. But there are several ways to aggregate information; for this reason, many kinds of bars exist (time bars are the most common).
Observe the market for 5 minutes, note down the first observed price (open), the lowest price (low), the highest price (high) and the price of the last tick that belongs to the chosen time interval (close) and you will have built a 5 minute bar!
However, markets, unlike humans, do not follow a time clock. They do not process information at constant time intervals. They rather do so event by event, transaction by transaction. So, what if we abandoned the time clock and started sampling market prices using a different logic? We could use the volume clock to build volume bars for example; or we could build tick bars and sample prices every time we observe a given amount of new transactions. Volume and tick bars are known sampling methods and I do not think they deserve an entire article as you can find plenty of information on the web.
But, what happens if we use an information clock? What if we sampled prices every time an unexpected amount of information comes to the market? Well, this is precisely the idea behind information-driven bars. Interesting, isn’t it? We are going to introduce the simplest kind of information-driven bars: tick imbalance bars. Marcos Lopez De Prado presents them in his book Advances in Financial Machine Learning (AFML).
#information-driven-bars #trading #de-prado-advances-in-ml #financial-data-sampling #data visualization