Aim: After reading this post and Part 2, the reader should feel comfortable using PCA and able to explain what these numbers fra PCA mean.
Audiences: Part 1 does not require any math background, mostly is logic and intuition. Part 2 will assume that the reader is familiar with matrix, eigenvalue, and eigenvector.
Table of content:
- Introduction
- The intuition of PCA
- A simple example
- Summary
Introduction
What is PCA, and why do you care?
Principal component analysis (PCA) is widely used fordata science and machine learning. PCA can reduce dimension such that it is less heavy for further process. But how could that be possible? Do we lose information? The answer is that we do lose some information, but not a lot if we do it in a smart way. This post is the convenience that it is possible with visualization and hand-calculation.
There are many PCA tutorials out there. What makes this post different from others?
There are many resources on the internet to teach PCA. Some of them are too shallow that readers do not feel confident to use it. Some of them are too mathematically in-depth that require the reader to have a good math background. I, personally, very like math and believe there is a way to make sense of these numbers from PCA without going through many mathematic theorems.
In Part I, we will explain what PCA is, when do you need it, and why do you need it. We will show you the very basic idea and intuition of PCA and some simple examples and hand-calculate some numbers to give you some flavor.
In Part II, we will transform our intuition of PCA into mathematic and interpret the data from PCA.
The intuition of PCA
Nothing but rotating the coordinate
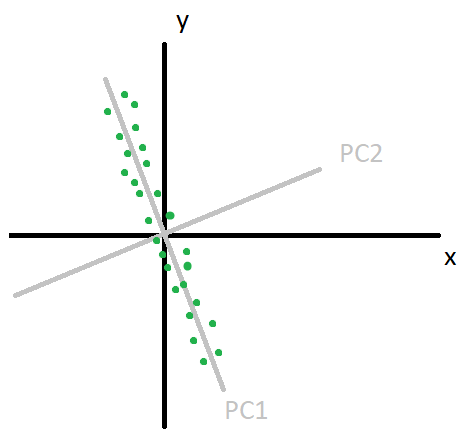
Figure1. Source: Hand drew by the author.
Before we explain what PCA is, let us take a look at image 1. Our data are those green points. They are originally represented in **(x,y) **coordinate. In real-life applications, **XY **pairs can be weight and height. They can be income and health, and etc. Just make sure they are in the mean-deviation form, which means the mean of data is zero in all dimensions. And somehow, we have found a new orthogonal coordinate system (PC1, PC2). In our data, we can clearly see that the data spread along with PC1-axis. And PC2-axis does not represent the data very much because most of our data points are very close to zero in PC2-axis.
Two simple questions
Q: Could we drop the PC2-axis when we use (PC1, PC2) coordinate and still able to preserve most of the information?
A: Yes, we can. Remove PC2-axis is the same as projecting all data points on PC1-axis, and it does not do much change in (x,y) after projection on PC1-axis.
Q: Could we see how much contribute does xy-axis have on PC1-axis from the image?
A: Yes, we can. It is clear that PC1-axis has much more projection on y-axis than x-axis does.
So, What is PCA? PCA is all about finding the new coordinate in image 1. More precisely, PCA is all about rotating the coordinate system (frame of reference) for a better representation of your data. In most case, it turns out some of the dimensions does not give much representation of our data, and it can be dropped without losing much information. But what a minute, why do we want to reduce the dimension of the data? In real-life applications, Our data can have more than hundreds of dimensions. And In many cases, it turns out the new coordinate found from PCA, only a few of these hundreds of dimensions is responsible for 90% of data. This is good news because the fewer dimension your data have, the less the computational heavy. Another reason we would like to use PCA is that we can gain insight into our data. It can tell us which few dimensions in our original coordinate dominate the data. OK! How can we find this new coordinate? Let us see an example.
#linear-algebra #machine-intelligence #principal-component #data-science #machine-learning #machine learning