If you can’t explain it simply, you don’t understand it well enough. — Albert Einstein
Disclaimer: This article draws and expands upon material from (1) Christoph Molnar’s excellent book on Interpretable Machine Learningwhich I definitely recommend to the curious reader, (2) a deep learning visualization workshop from Harvard ComputeFest 2020, as well as (3) material from CS282R at Harvard University taught by Ike Lage and Hima Lakkaraju, who are both prominent researchers in the field of interpretability and explainability. This article is meant to condense and summarize the field of interpretable machine learning to the average data scientist and to stimulate interest in the subject.
Machine learning systems are becoming increasingly employed in complex high-stakes settings such as medicine (e.g. radiology, drug development), financial technology (e.g. stock price prediction, digital financial advisor), and even in law (e.g. case summarization, litigation prediction). Despite this increased utilization, there is still a lack of sufficient techniques available to be able to explain and interpret the decisions of these deep learning algorithms. This can be very problematic in some areas where the decisions of algorithms must be explainable or attributable to certain features due to laws or regulations (such as the right to explanation), or where accountability is required.
The need for algorithmic accountability has been highlighted many times, the most notable cases of which are Google’s facial recognition algorithm that labeled some black people as gorillas, and Uber’s self-driving car which ran a stop sign. Due to the inability of Google to fix the algorithm and remove the algorithmic bias that resulted in this issue, they solved the problem by removing words relating to monkeys from Google Photo’s search engine. This illustrates the alleged black box nature of many machine learning algorithms.
The black box problem is predominantly associated with the supervised machine learning paradigm due to its predictive nature.
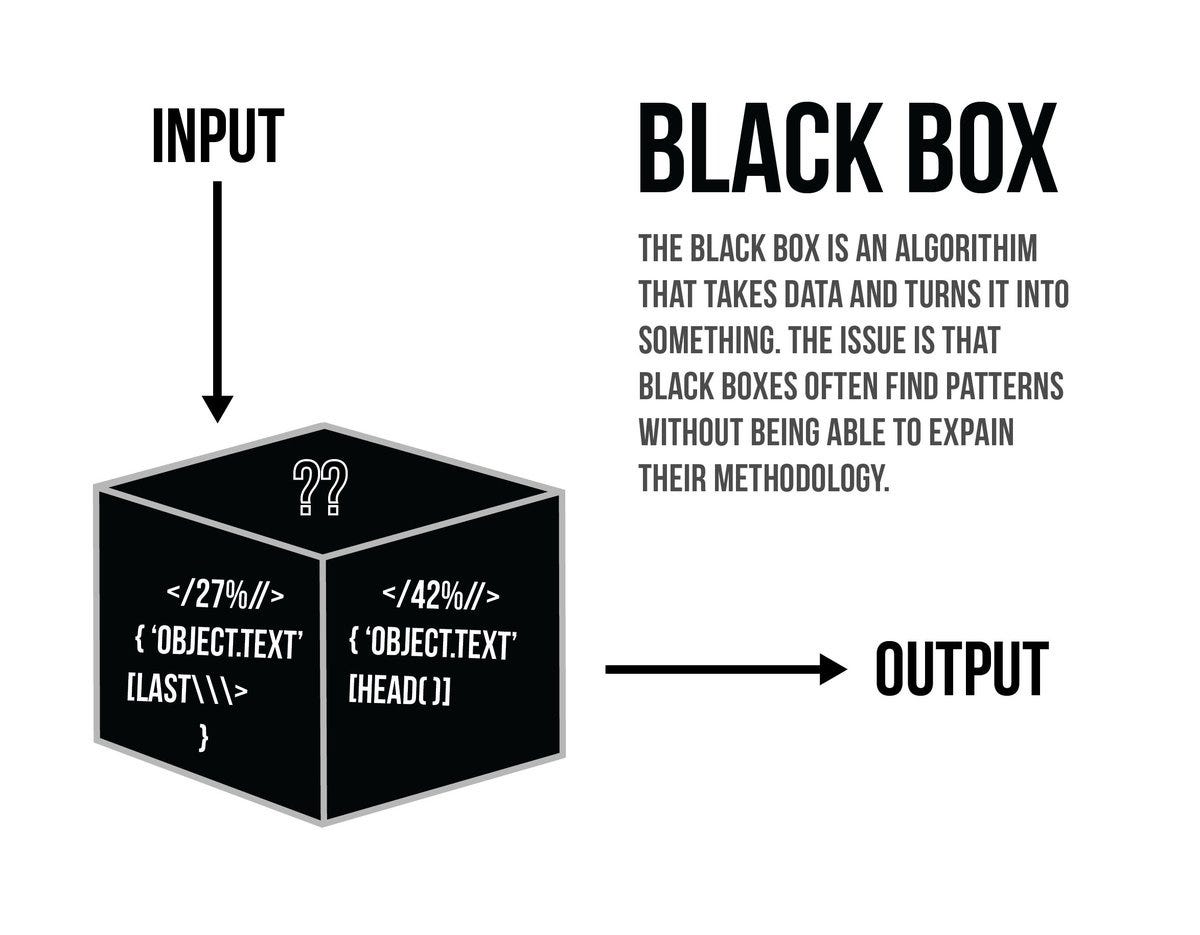 The black box algorithm — who knows what it’s doing? Apparently, nobody.
Accuracy alone is no longer enough.
Academics in deep learning are acutely aware of this interpretability and explainability problem, and whilst some argue (such as Sam Harris in the above quote) that these models are essentially black boxes, there have been several developments in recent years which have been developed for visualizing aspects of deep neural networks such the features and representations they have learned. The term info-besity has been thrown around to refer to the difficulty of providing transparency when decisions are made on the basis of many individual features, due to an overload of information. The field of interpretability and explainability in machine learning has exploded since 2015 and there are now dozens of papers on the subject, some of which can be found in the references.
As we will see in this article, these visualization techniques are not sufficient for completely explaining the complex representations learned by deep learning algorithms, but hopefully, you will be convinced that the black box interpretation of deep learning is not true — we just need better techniques to be able to understand and interpret these models.
The Black Box
All algorithms in machine learning are to some extent black boxes. One of the key ideas of machine learning is that the models are data-driven — the model is configured from the data. This fundamentally leads us to problems such as (1) how we should interpret the models, (2) how to ensure they are transparent in their decision making, and (3) making sure the results of the said algorithm are fair and statistically valid.
For something like linear regression, the models are very well understood and highly interpretable. When we move to something like a support vector machine (SVM) or a random forest model, things get a bit more difficult. In this sense, there is no white or black box algorithm in machine learning, the interpretability exists as a spectrum or a ‘gray box’ of varying grayness.
It just so happens, that at the far end of our ‘gray’ area is the neural network. Even further in this gray area is the deep neural network. When you have a deep neural network with 1.5 billion parameters — as the GPT-2 algorithm for language modeling has — it becomes extremely difficult to interpret the representations that the model has learned.
In February 2020, Microsoft released the largest deep neural network in existence (probably not for long), Turing-NLG. This network contains 17 billion parameters, which is around 1/5th of the 85 billion neurons present in the human brain (although in a neural network, parameters represent connections, of which there are ~100 trillion in the human brain). Clearly, interpreting a 17 billion parameter neural network will be incredibly difficult, but its performance may be far superior to other models because it can be trained on huge amounts of data without becoming saturated — this is the idea that more complex representations can be stored by a model with a greater number of parameters.
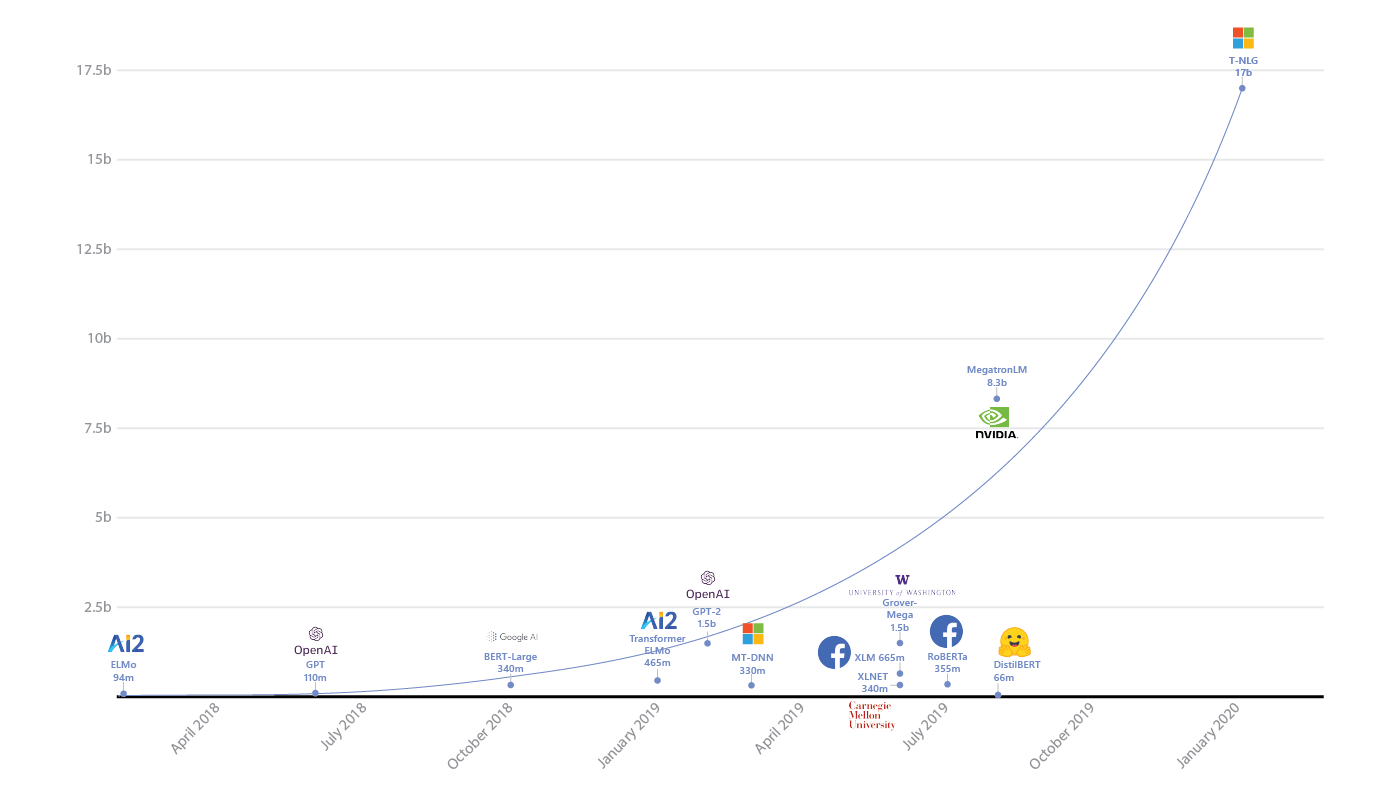 Comparison of Turing-NLG to other deep neural networks such as BERT and GPT-2. Source
Obviously, the representations are there, we just do not understand them fully, and thus we must come up with better techniques to be able to interpret the models. Sadly, it is more difficult than reading coefficients as one is able to do in linear regression!
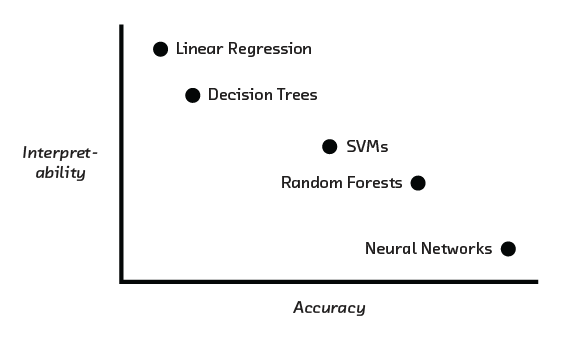 Neural networks are powerful models, but harder to interpret than simpler and more traditional models.
Often, we do not care how an algorithm came to a specific decision, particularly when they are operationalized in low-risk environments. In these scenarios, we are not limited in our selection of algorithms by any limitation on the interpretability. However, if interpretability is important within our algorithm — as it often is for high-risk environments — then we must accept a tradeoff between accuracy and interpretability.
So what techniques are available to help us better interpret and understand our models? It turns out there are many of these, and it is helpful to make a distinction between what these different types of techniques help us to examine.
Local vs. Global
Techniques can be local, to help us study a small portion of the network, as is the case when looking at individual filters in a neural network.
Techniques can be global, allowing us to build up a better picture of the model as a whole, this could include visualizations of the weight distributions in a deep neural network, or visualizations of neural network layers propagating through the network.
Model-Specific vs. Model-Agnostic
A technique that is highly model-specific is only suitable for use by a single type of models. For example, layer visualization is only applicable to neural networks, whereas partial dependency plots can be utilized for many different types of models and would be described as model-agnostic.
Model-specific techniques generally involve examining the structure of algorithms or intermediate representations, whereas model-agnostic techniques generally involve examining the input or output data distribution.
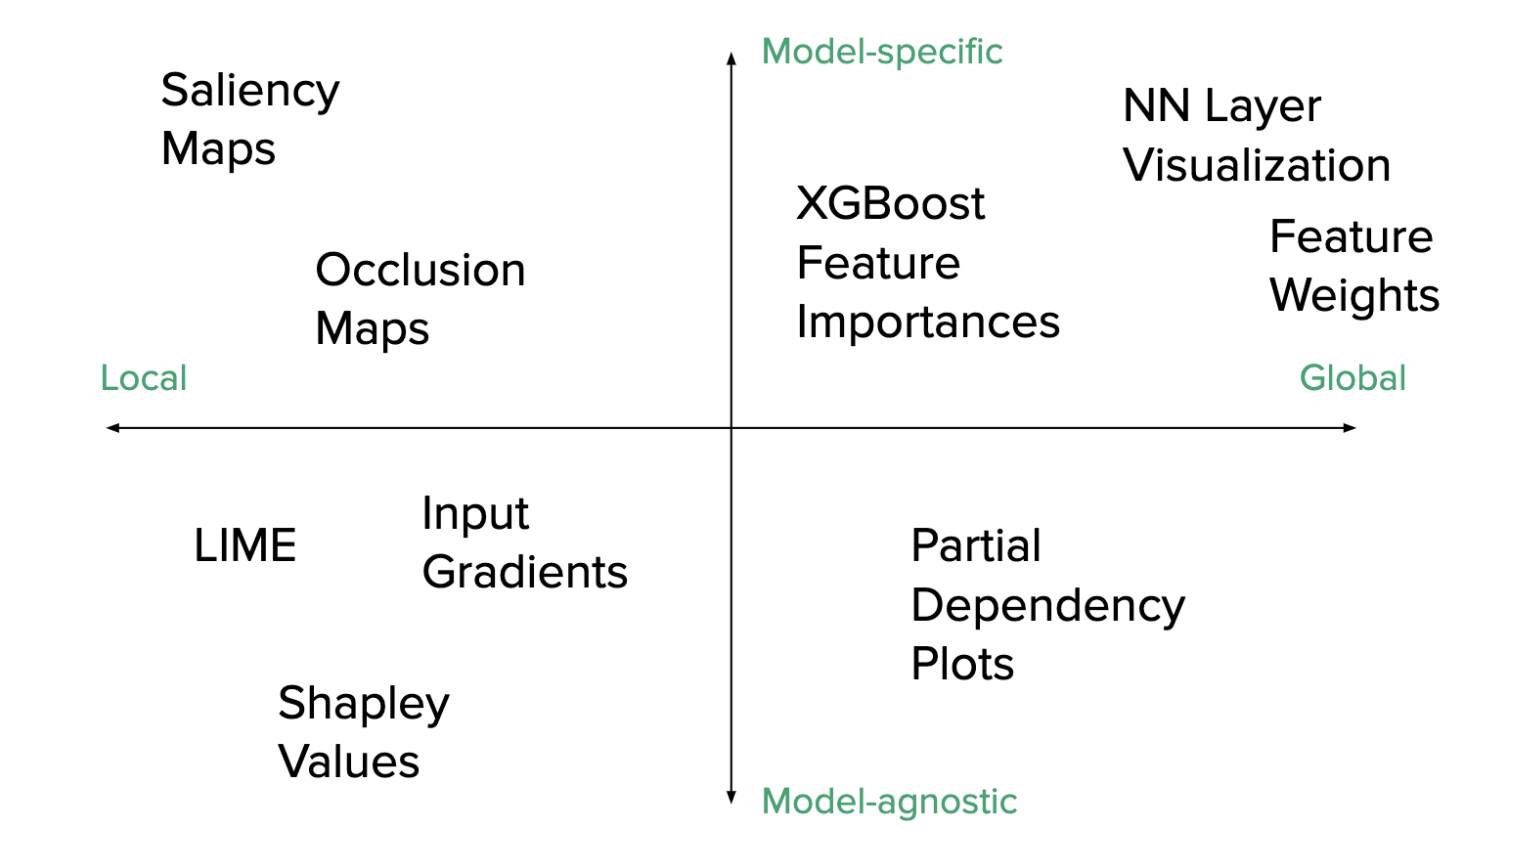 The distinction between different model visualization techniques and interpretability metrics. Source
I will discuss all of the above techniques throughout this article, but will also discuss where and how they can be put to use to help provide us with insight into our models.
Being Right for the Right Reasons
One of the issues that arise from our lack of model explainability is that we do not know what the model has been trained on. This is best illustrated with an apocryphal example (there is some debate as to the truth of the story, but the lessons we can draw from it are nonetheless valuable).
Hide and Seek
According to AI folklore, in the 1960s, the U.S. Army was interested in developing a neural network algorithm that was able to detect tanks in images. Researchers developed an algorithm that was able to do this with remarkable accuracy, and everyone was pretty happy with the result.
However, when the algorithm was tested on additional images, it performed very poorly. This confused the researchers as the results had been so positive during development. After a while of everyone scratching their heads, one of the researchers noticed that when looking at the two sets of images, the sky was darker in one set of images than the other.
It became clear that the algorithm had not actually learned to detect tanks that were camouflaged, but instead was looking at the brightness of the sky!
Whilst this story exacerbates one of the common criticisms of deep learning, there is truth to the fact that in a neural network, and especially a deep neural network, you do not really know what the model is learning.
This powerful criticism and the increasing importance of deep learning in academia and industry is what has led to an increased focus on interpretability and explainability. If an industry professional cannot convince their client that they understand what the model they built is doing, should it be really be used when there are large risks, such as financial losses or people’s lives?
Interpretability
At this point, you might be asking yourself how visualization can help us to interpret a model, given that there may be an infinite number of viable interpretations. Defining and measuring what interpretability means is not a trivial task, and there is little consensus on how to evaluate it.
There is no mathematical definition of interpretability. Two proposed definitions in the literature are:
“Interpretability is the degree to which a human can understand the cause of a decision.”** — Tim Miller**
“Interpretability is the degree to which a human can consistently predict the model’s result.” — Been Kim
The higher the interpretability of a machine learning model, the easier it is for someone to comprehend why certain decisions or predictions have been made. A model is better interpretable than another model if its decisions are easier for a human to comprehend than decisions from the other model. One way we can start to evaluate model interpretability is via a quantifiable proxy.
A proxy is something that is highly correlated with what we are interested in studying but is fundamentally different from the object of interest. Proxies tend to be simpler to measure than the object of interest, or like in this case, just measurable — whereas our object of interest (like interpretability) may not be.
The idea of proxies is prevalent in many fields, one of which is psychology where they are used to measure abstract concepts. The most famous proxy is probably the intelligence quotient (IQ) which is a proxy for intelligence. Whilst the correlation between IQ and intelligence is not 100%, it is high enough that we can gain some useful information about intelligence from measuring IQ. There is no known way for directly measuring intelligence.
An algorithm that uses dimensional reduction to allow us to visualize high-dimensional data in a lower-dimensional space provides us with a proxy to visualize the data distribution. Similarly, a set of training images provides us with a proxy of the full data distribution of interest, but will inevitably be somewhat different to the true distribution (if you did a good job constructing the training set, it should not differ too much from a given test set).
What about post-hoc explanations?
Post-hoc explanations (or explaining after the fact) can be useful but sometimes misleading. These merely provide a plausible rationalization for the algorithmic behavior of a black box, not necessarily concrete evidence and so should be used cautiously. Post-hoc rationalization can be done with quantifiable proxies, and some of the techniques we will discuss do this.
Choosing a Visualization
Designing a visualization requires us to think about the following factors:
- **The audience to whom we are presenting (the who) **— is this being done for debugging purposes? To convince a client? To convince a peer-reviewer for a research article?
- The objective of the visualization (the what)— are we trying to understand the inputs (such as if EXIF metadata from an image is being read correctly so that an image does not enter a CNN sideways), outputs, or parameter distributions of our model? Are we interested in how inputs evolve through the network or a static feature of the network like a feature map or filter?
- The model being developed (the how)— clearly, if you are not using a neural network, you cannot visualize feature maps of a network layer. Similarly, feature importance can be used for some models, such as XGBoost or Random Forest algorithms, but not others. Thus the model selection inherently biases what techniques can be used, and some techniques are more general and versatile than others. Developing multiple models can provide more versatility in what can be examined.
Deep models present unique challenges for visualization: we can answer the same questions about the model, but our method of interrogation must change! Because of the importance of this, we will mainly focus on deep learning visualization for the rest of the article.
Subfields of Deep Learning Visualization
There are largely three subfields of deep learning visualization literature:
- Interpretability & Explainability: helping to understand how deep learning models make decisions and their learned representations.
- Debugging & Improving: helping model curators and developers construct and troubleshoot their models, with the hope of expediting the iterative experimentation process to ultimately improve performance.
- Teaching Deep Learning: helping to educate amateur users about artificial intelligence — more specifically, machine learning.
Why is interpreting a neural network so difficult?
To understand why interpreting a neural network is difficult and non-intuitive, we have to understand what the network is doing to our data.
Essentially, the data we pass to the input layer — this could be an image or a set of relevant features for predicting a variable — can be plotted to form some complex distribution like that shown in the image below (this is only a 2D representation, imagine it in 1000 dimensions).
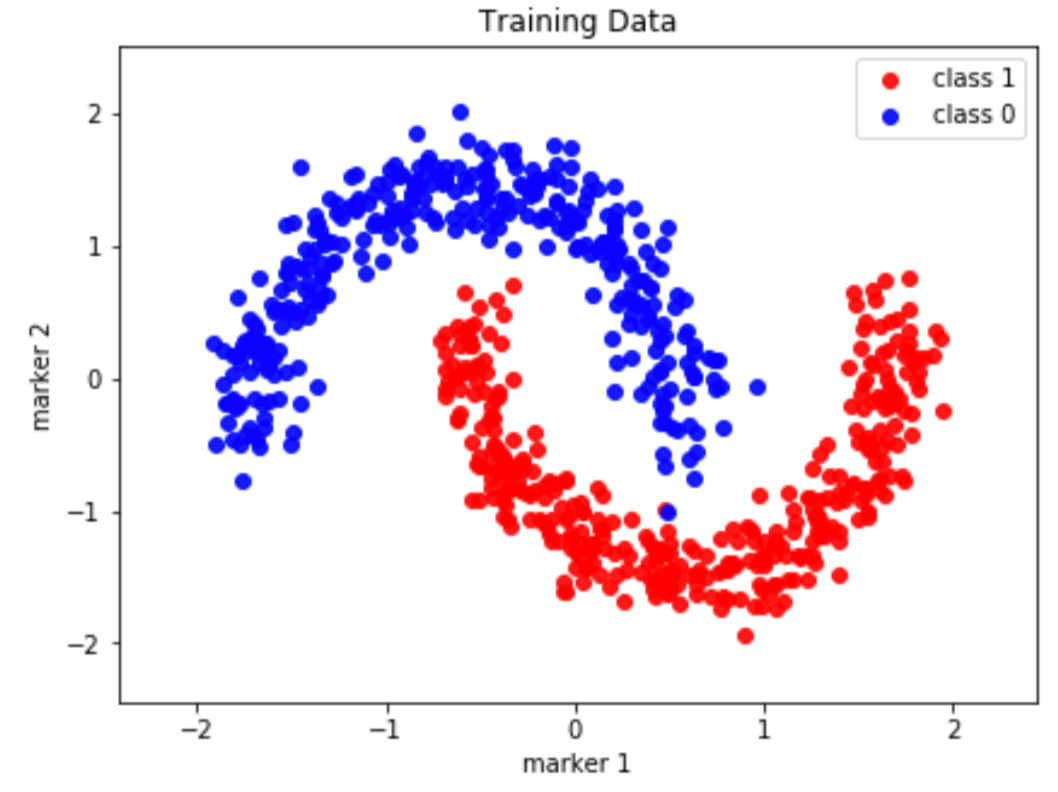
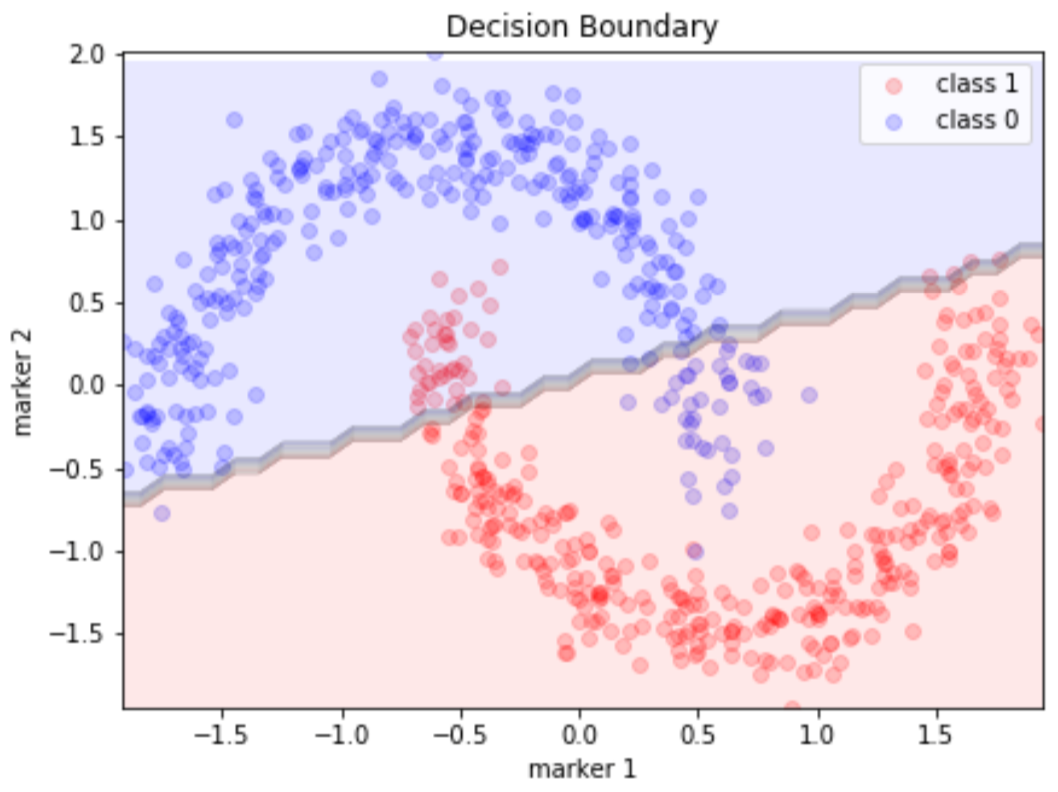
If we ran this data through a linear classifier, the model would try its best to separate the data, but since we are limited to a hypothesis class that only contains linear functions, our model will perform poorly since a large portion of the data is not linearly separable.
This is where neural networks come in. The neural network is a very special function. It has been proven that a neural network with a single hidden layer is capable of representing the hypothesis class of all non-linear functions, as long as we have enough nodes in the network. This is known as the universal approximation theorem.
It turns out that the more nodes we have, the larger our class of functions we can represent. If we have a network with only ten layers and are trying to use it to classify a million images, the network will quickly saturate and reach maximum capacity. If we have 10 million parameters, it will be able to learn a much better representation of the network, as the number of non-linear transformations increases. We say this model has a larger model capacity.
People use deep neural networks instead of a single layer because the amount of neurons needed in a single layer network increases exponentially with model capacity. The abstraction of hidden layers significantly reduces the need for more neurons but this comes at a cost for interpretability. The deeper we go, the less interpretable the network becomes.
The non-linear transformations of the neural network allow us to remap our data into a linearly separable space. At the output layer of a neural network, it then becomes arbitrary for us to separate our initially non-linear data into two classes using a linear classifier, as illustrated below.
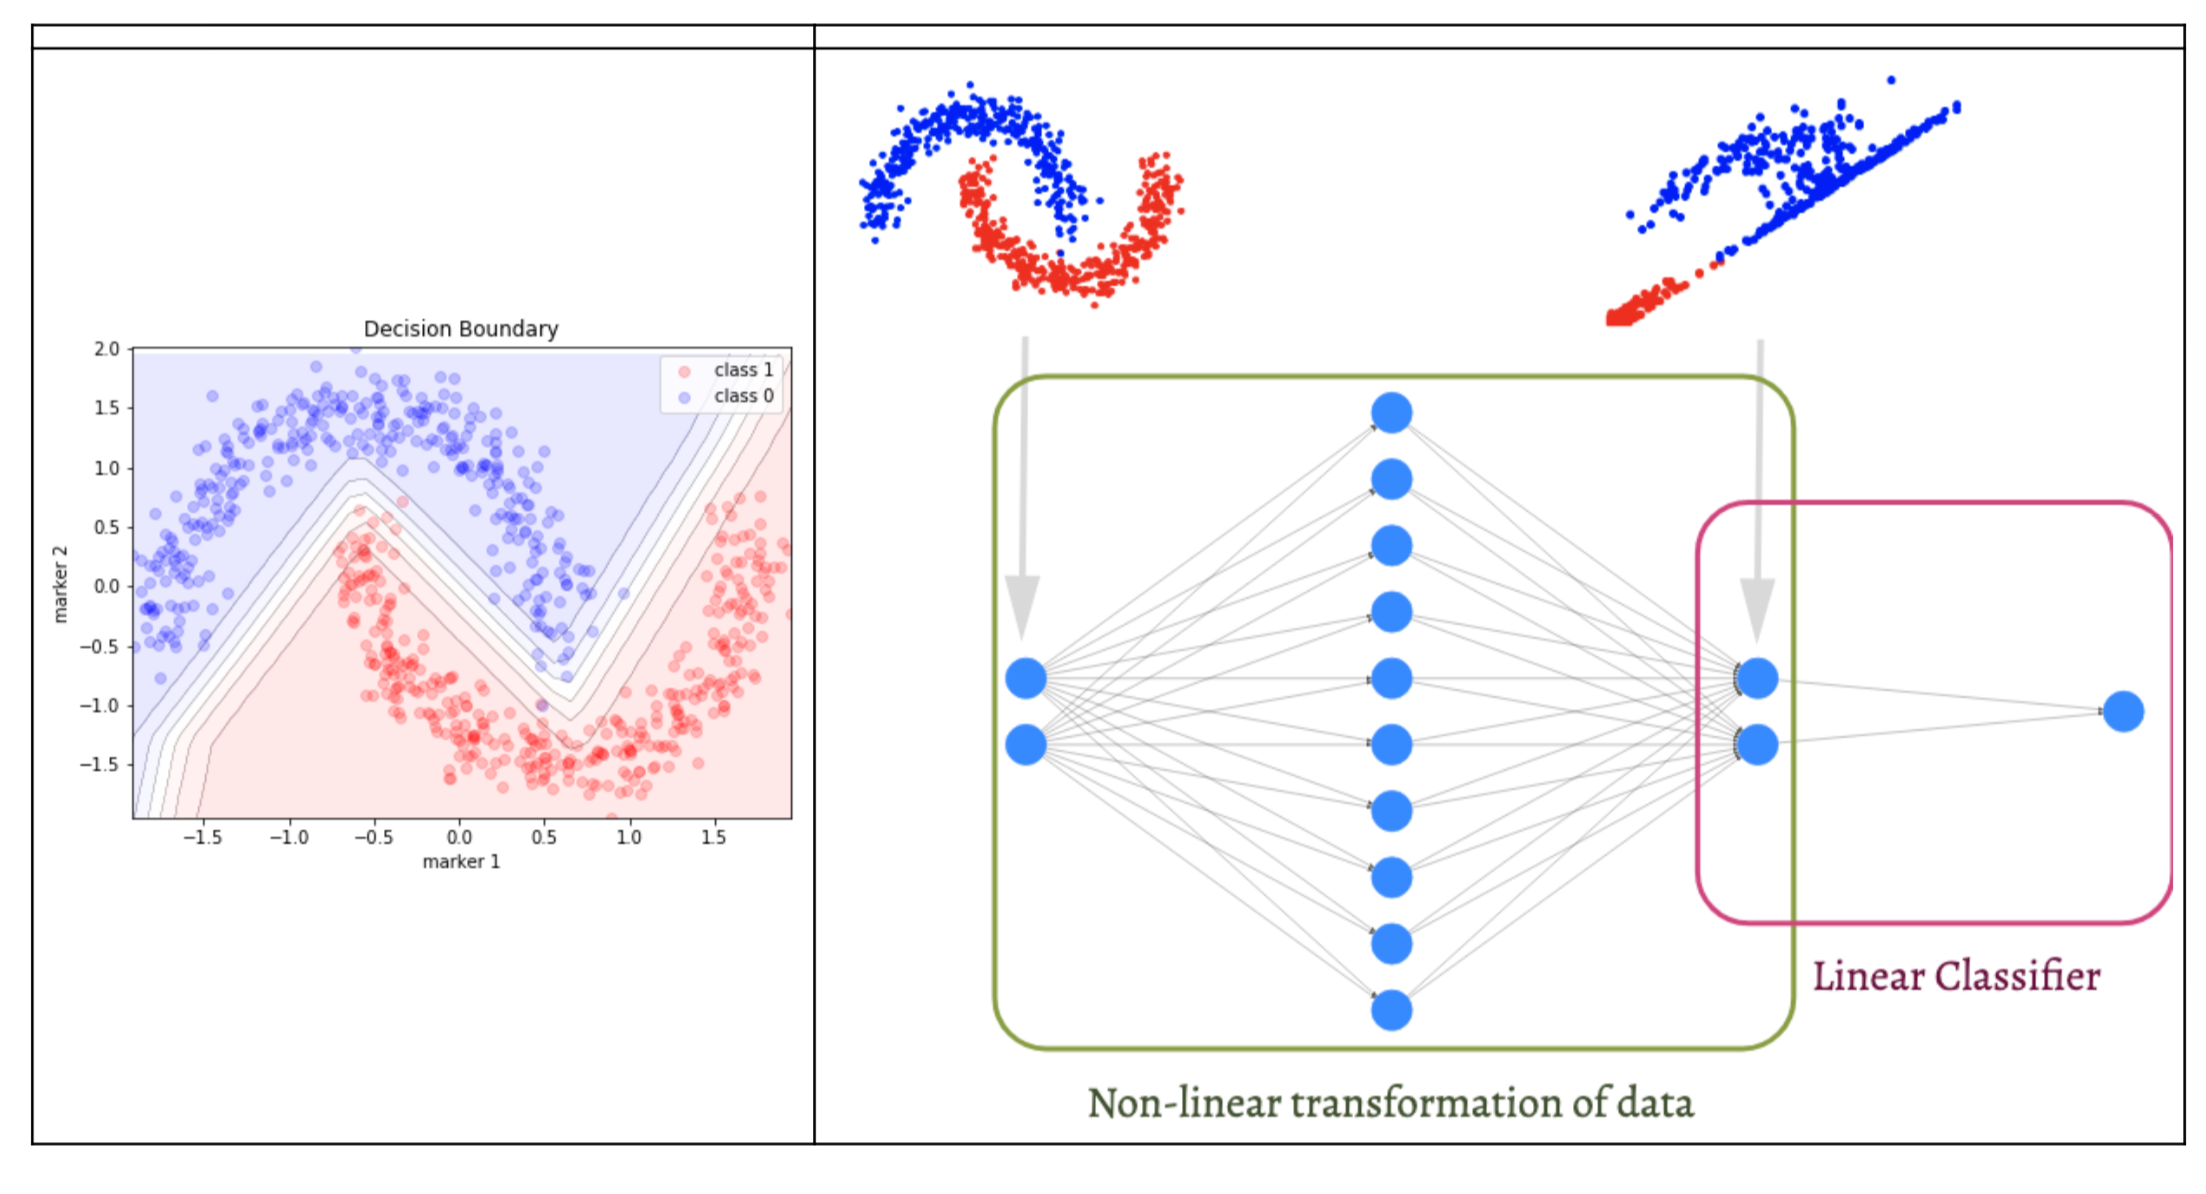 The transformation of a non-linear dataset to one that is linearly separable using a neural network. Source
The question is, how do we know what is going on within this multi-layer non-linear transformation, which may contain millions of parameters?
Imagine a GAN model (two networks fighting each other in order to mimic the distribution of the input data) working on a 512×512 image dataset. When images are introduced into a neural network, each pixel becomes a feature of the neural network. For an image of this size, the number of features is 262,144. This means we are performing potentially 8 or 9 convolutional and non-linear transformations on over 200,000 features. How can one interpret this?
Go even more extreme to the case of 1024×1024 images, which have been developed by NVIDIA’s implementation of StyleGAN. Since the number of pixels increases by a factor of four with a doubling of image size, we would have over a million features as our input to the GAN. So we now have a one million feature neural network, performing convolutional operations and non-linear activations, and doing this over a dataset of hundreds of thousands of images.
Hopefully, I have convinced you that interpreting deep neural networks is profoundly difficult. Although the operations of a neural network may seem simple, they can produce wildly complex outcomes via some form of emergence.
#ai & machine learning #algorithm #black box #deep learning #machine learning #deep learning