R Programming language is an open-source software developed by statisticians and it is widely used among Data Miners for developing Data Analysis. R can be best programmed and developed in RStudio which is an IDE (Integrated Development Environment) for R. The advantages of R programming language include quality plotting and eye catching reports, vast source of packages used for various functions, exemplary source for Data Wrangling, performance of various Machine Learning operations and flashy for Statistics. In my experience, R is the best language for self-learning and also it is very flexible for Financial Analysis and Graphing.
In this article, we are going to create six trading strategies and backtest its results using R and its powerful libraries.
Steps Involved in this process
1. Importing required libraries
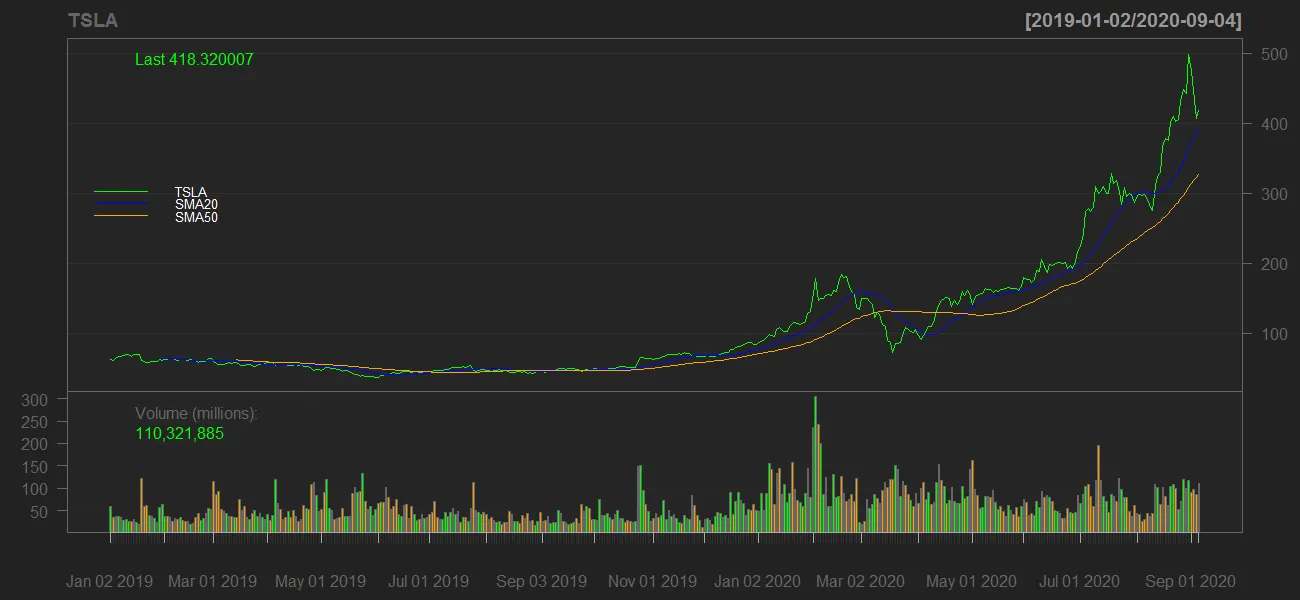
2. Extracting stock data (Apple, Tesla, Netflix) from Yahoo and Basic Plotting
3. Creating technical indicators
4. Creating trading signals
5. Creating trading strategies
6. Backtesting and Comparing the results
Step-1 : Importing required libraries
Firstly, to perform our process of creating trading strategies, we have to import the required libraries to our environment. Throughout this process, we will be using some of the most popular finance libraries in R namely Quantmod, TTR and Performance Analytics. Using the library function in R, we can import our required packages. Let’s do it!
#finance #stock-market #technical-analysis #programming #data-science