The inspiration for this post have come from a post on Harvard Sports Analysis. I want to extend it for a couple more seasons than the original one and to explore what lies behind this development of NBA offense. It might give an idea for people to understand why there are more comebacks than ever in the recent years, as well.
As it is already stated, there is an unofficial law, Lawler’s Law, which is created by Ralph Lawler, who is the Los Angeles Clippers broadcaster, and named after him few years ago. Obviously, 100 is an arbitrary number for this kind of analysis but when we check the total points scored in a game in the NBA, it seems like a reasonable number to go by.
Here, it is better to start how the scoring has changed over the time. Below graph represents the scoring output from the beginning of the play-by-play era(1996–97 season) to 2019–20 season.
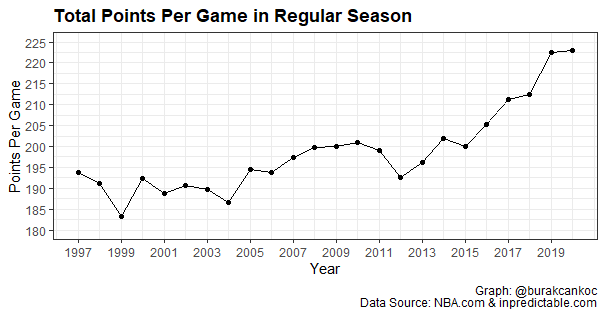
Total Points per Game in NBA — Image by Author
Fair to say there is a trend, especially after 2014-2015, when the scoring total has been increased significantly. The change has been backed up with a statistical method, t-test, and we can say there are two different eras in the recent history of NBA. The t-test, which gives a p-value of 0.00228, allows us to say there is a significant statistical difference in means between two eras.
To understand the reasons underlie this change, I deep dived a couple of stats: points per possession and pace in last 24 years. Not surprisingly, the game has become faster than before and as a result of both increasing pace and talent pool, the NBA offenses generate more points than they previously had.
#data-science #data-visualization #sports-analytics